Question
Century Continental Group Incorporated (CCGI) has the following operating segments. Mall Residential Commercial Hotels and Convention Centers Segment performance is evaluated based on operating income
Century Continental Group Incorporated (CCGI) has the following operating segments.
- Mall
- Residential
- Commercial
- Hotels and Convention Centers
Segment performance is evaluated based on operating income or loss, and is measured consistently with the operating income or loss in the consolidated financial statement. Transfer prices between business segments are set on an arm's length basis for similar transactions with non-related parties. These transfers are eliminated in the consolidated financial statements
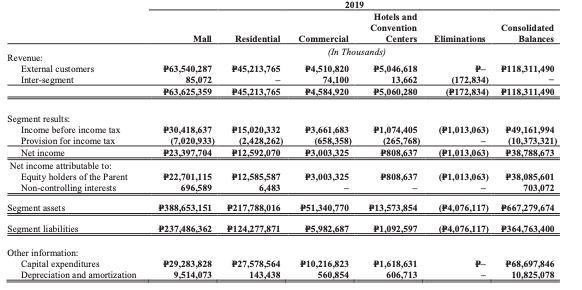
Financial data for the business segments of CCGI below.

Based on the above information computed for the following:
- Return on investment (ROI) of each of the business segments.
- Residual Income.
- Assume that CCGI required a minimum required rate of return of 12%, 20%, 10%, and 7% for the Mall, Residential, Commercial, Hotels and Convention Centers respectively, and a business opportunity that would yield a return of 15% is presented to each business unit.
- If performance is measured by ROI which division or divisions will likely accept the opportunity? Which division or divisions will reject? Why?
- If performance is measured by residual income which division will likely accept the opportunity? Which division or divisions will reject? Why?
2019 Hotels and Convention Consolidated Mall Residential Commercial Centers Eliminations Balances (In Thousands) Revenue: External customers P63,540,287 85.072 P63.625.359 P45,213,765 P4,510,820 74.100 P4,584.920 P5,046,618 13,662 P5,060,280 P118,311,490 Inter-se gment (172,834) (P172,834) P118,311,490 P45,213,765 Segment results Income before income tax P30,418,637 (7.020,933) P23,397,704 P15,020,332 (2.428,262) P12,592,070 P3,661,683 (658,358) P3,003,325 P1,074,405 (265,768) P808,637 (P1,013,063) P49,161,994 (10,373,321) P38,788,673 Provision for income tax Net income Net income attributable to: Equity holders of the Parent Non-controlling interests (P1,013,063) P22,701,115 696,589 P12,585,587 6,483 P3,003,325 P808,637 P38,085,601 703,072 (P1,013,063) Segment assets P388,653,151 P217,788,016 P51,340,770 P13,573,854 P4,076.117) P667,279,674 Segment liabilities P237,486.362 P124.277,871 P5,982.687 P1,092,597 (P4,076.117) P364,763,400 Other information: Capital expenditures Depreciation and amortization P29,283,828 9,514.073 P27,578,564 143,438 P10,216,823 560.854 P1,618,631 P68,697,846 606,713 10,825,078
Step by Step Solution
3.36 Rating (149 Votes )
There are 3 Steps involved in it
Step: 1

Get Instant Access to Expert-Tailored Solutions
See step-by-step solutions with expert insights and AI powered tools for academic success
Step: 2

Step: 3

Ace Your Homework with AI
Get the answers you need in no time with our AI-driven, step-by-step assistance
Get Started


