Answered step by step
Verified Expert Solution
Question
1 Approved Answer
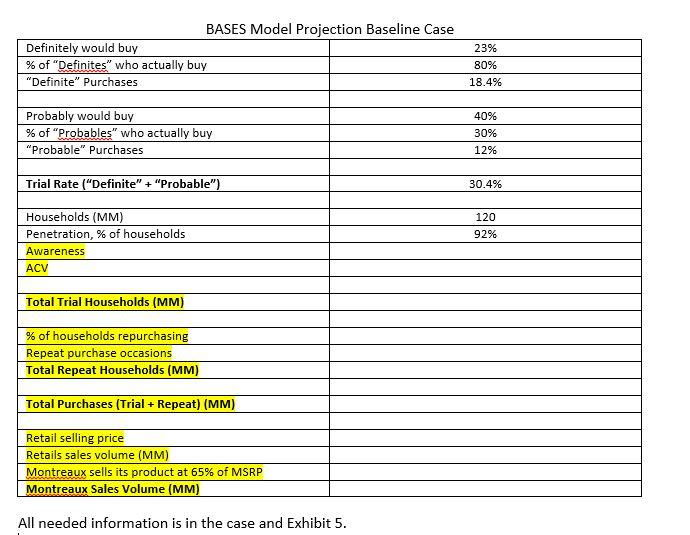
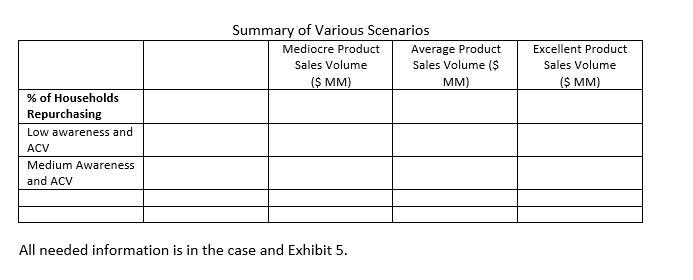
fill out the two tables using the figures from Exhibit 5. I was able to fill half of one table, but have been unable to
fill out the two tables using the figures from Exhibit 5. I was able to fill half of one table, but have been unable to figure out the rest. Include your calculations and how you got to the numbers!!!


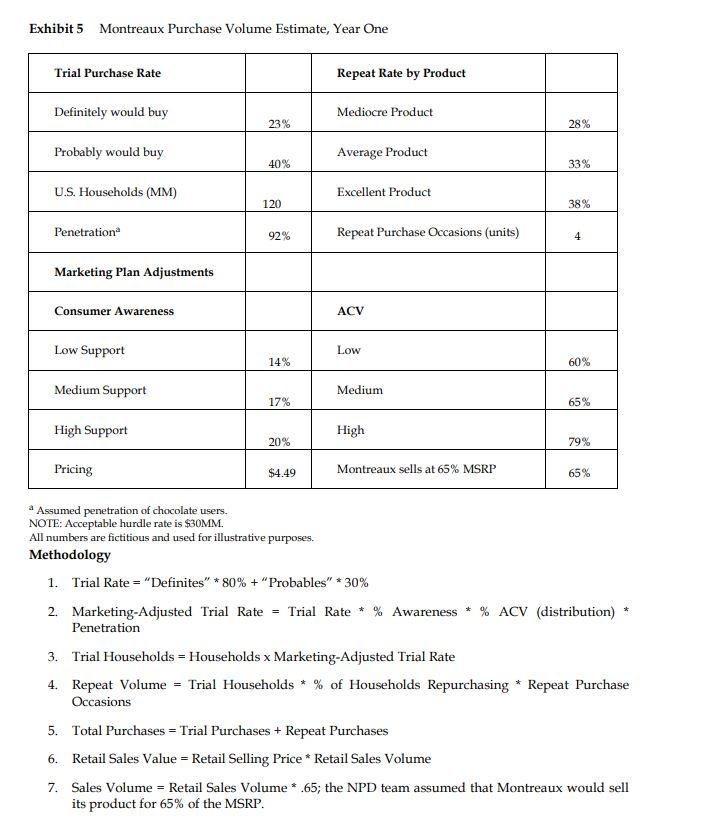
Exhibit 5 Montreaux Purchase Volume Estimate, Year One Trial Purchase Rate Definitely would buy Probably would buy U.S. Households (MM) Penetration Marketing Plan Adjustments Consumer Awareness Low Support Medium Support High Support Pricing 23% 40% 120 92% 14% 17% 20% $4.49 Repeat Rate by Product Mediocre Product Average Product Excellent Product Repeat Purchase Occasions (units) ACV Low Medium High Montreaux sells at 65% MSRP 28% 33% 38% 4 60% 65% 79% 65% Assumed penetration of chocolate users. NOTE: Acceptable hurdle rate is $30MM. All numbers are fictitious and used for illustrative purposes. Methodology 1. Trial Rate = "Definites" * 80% + "Probables" *30% 2. Marketing-Adjusted Trial Rate = Trial Rate * % Awareness * % ACV (distribution) Penetration 3. Trial Households Households x Marketing-Adjusted Trial Rate 4. Repeat Volume = Trial Households * % of Households Repurchasing * Repeat Purchase Occasions 5. Total Purchases = Trial Purchases + Repeat Purchases 6. Retail Sales Value = Retail Selling Price * Retail Sales Volume 7. Sales Volume = Retail Sales Volume * .65; the NPD team assumed that Montreaux would sell its product for 65% of the MSRP.
Step by Step Solution
★★★★★
3.47 Rating (160 Votes )
There are 3 Steps involved in it
Step: 1
Students Name Institution Course Code Date BASES Model Projection Baseline Case Definitely would buy ...
Get Instant Access to Expert-Tailored Solutions
See step-by-step solutions with expert insights and AI powered tools for academic success
Step: 2

Step: 3

Ace Your Homework with AI
Get the answers you need in no time with our AI-driven, step-by-step assistance
Get Started


