Answered step by step
Verified Expert Solution
Question
1 Approved Answer
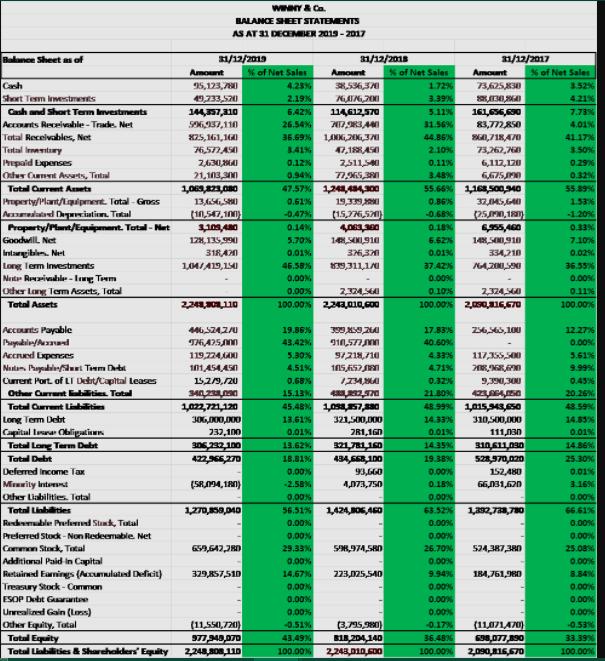
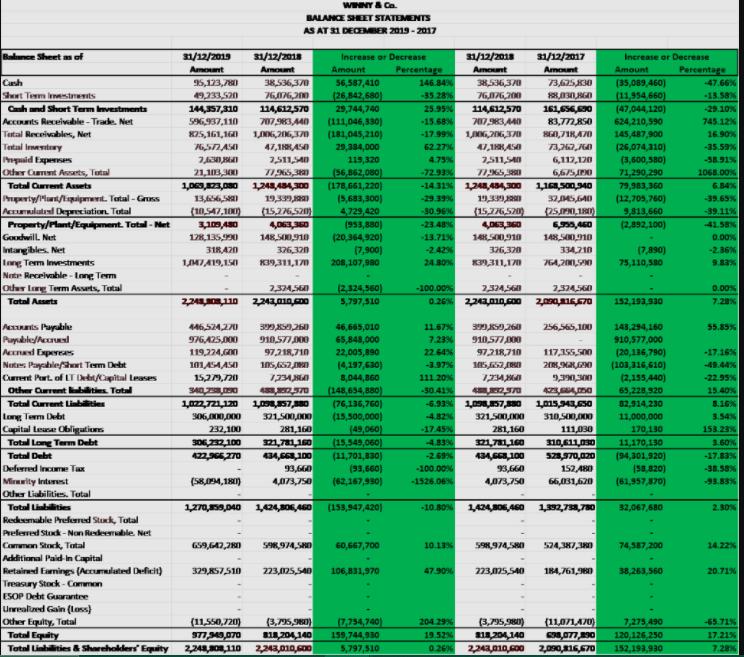
How to write the findings/conclusions for Horizontal Analysis & Vertical Analysis based on below Balance Sheet Statement? Image 1- Vertical Analysis, Image 2- Horizontal Analysis
How to write the findings/conclusions for Horizontal Analysis & Vertical Analysis based on below Balance Sheet Statement? Image 1- Vertical Analysis, Image 2- Horizontal Analysis
Image 1:

Image 2:

WINY& Ca. BALANCE SHEET STATEMENTS AS AT 31 DECEMBER 2015 - 2017 Balance Sheet s of 1/12/2019 31/12/2018 1/12/2017 % of Net Sales % of Net Sales % of Net Sales 3.52% Amount Amount 38,536,3 Amount Cash Short Tem iwstmets Cash and Short Term Investments 95,123,70 4.28% 1.72% 73,62530 49,733,520 2.19% 3.39% 4.21% 6.42% 3.11% 7.73% 144,57,310 SO6,937,110 X25, 1461,144 114,612570 161656,60 83,772RS0 31.56% Accunts Receivable - Trades. Net Tatal Recelvables, Net Tertal Ientay 26.54% 4.01% 36.69% 44.86% 41.17% 76,5ASI B41% 47,18RASI 2.10% 73,262,70 3.50% Prepaid Expenses 0.12% 2,511,50 0.11% 6,112,120 0.296 Otur Cmet Anarts, Tetal 21,103,3NI 0,94% 0.32% 6675 55.66% 1,168so0,40 3.48% Tatal Crrent Asets 47.57% 1,24,484,300 35.89% Property/Mlant/Luipment. Total - Gross Aedatd Dwintion. Tetal Property/Pant/Eppement. Total - Net 13S,S 0.61% 19,339I O.86% 1.53% -0.47% (15,76,5) 0.68% 25, 1 1.20% 0.14% 0.18% 6,955,460 0.33% Goodwill Net 6.62% 7.10% 128,135,9 318A0 5.70% Intargiblen. Net Long Tem Investments 0.01% 0.01% 334,210 0.02% 10M/A19,10 46.58% 9,311,1 37.42% 36.55% Nester Rezivable - Ing Tem 0.00N 0.00% 0.00% ocher Lang Term Assets, Total 2,324,AI 100.00 2,0SI6,670 0.10% 2,324 56 100.00 224EL010,co0 0.00% 0.11% Tetal Assets 224 L10 100.00% Accounts Payable Paydalaaand Accred Expences Nustam. hayeablut Teem Debt 19.86% 17.83% 26,565,100 12.2776 THA5 119,224AANI 101 A54,AS0 43,42% 910,577 40.60% 0.00% 5.30% 91218,710 4.3% 117,355,S00 3.61% 4.51% 4.71% 9.99 Current Port. of LI Debt/tapital Leases Other Currant Tatal Total Carrent L Long Term Debt Capital lra Calipatian Tatal Long Term Debt 15,2/9,/20 0.68% 0.32% 9,30,300 0.43% 34023 4 70 45.48 1,057,a0 321,500,000 2R1,1GD 321,781,160 434,668,100 93,660 4,073,750 15.13% 21.80 20.26N 48.99 1015,943,50 310,500,000 111,030 48.59 13.61% 14.33% 14.85% 232,100 306,232,100 422,965,270 0.01% 0.01% 0.01% 13.62% 14.35% 14.86% 528,970,020 152,480 Total Debt 18.81% 19.38% 25.30% Deferred Income Tax 0.00% 0.00% stoo Miruwity Intert (SRM4, 180) -2.58% 0.18% 3.16% Other Liabilities. Tatal 0.00% 0.00% 0.00% Total Liabities ove'eca'azt 56.51% 1,424,BO6,460 63.52% 1,392,7a,780 66.61% Redemble Prefered Stank, Tulal Prelerred Stock - Non Redeematble. Net 0.00% 0.00% 0.00% 0.00% 0.00% 0.00% SR,974,S80 Common Stock, Total Additional Paid in Capital Restaireed Earninggs (Axulatad Deficit) Treasury Stock -Common ESOP Dett Garantee Unrealized Gain (Loss) Other Equity, Total Tutal Equity Total Libities & Sharcholders Equity 29.33 26.70N 524,387,380 25.08 0.00% 0.00% 0.00% 329,RS7,510 14.67% 223,025,540 9.94% 184,761,980 8.84% 0.00% 0.00% 0.00% 0.00% 0.00% 0.00% 0.00% 0.00% 0.00% (11,550,720) -0.51% (3,795,9) B18,204,140 2,243,01000 0.17% 36.48% (11,071A0) 0.53% 33.39% 43,49% 2,248,ROR,110 100.00% 100.00% 2,090RI6,670 100.00
Step by Step Solution
★★★★★
3.48 Rating (151 Votes )
There are 3 Steps involved in it
Step: 1
Image 1 Vertical Analysis Vertical analysis compares each amount with a base amount selected from th...
Get Instant Access to Expert-Tailored Solutions
See step-by-step solutions with expert insights and AI powered tools for academic success
Step: 2

Step: 3

Ace Your Homework with AI
Get the answers you need in no time with our AI-driven, step-by-step assistance
Get Started


