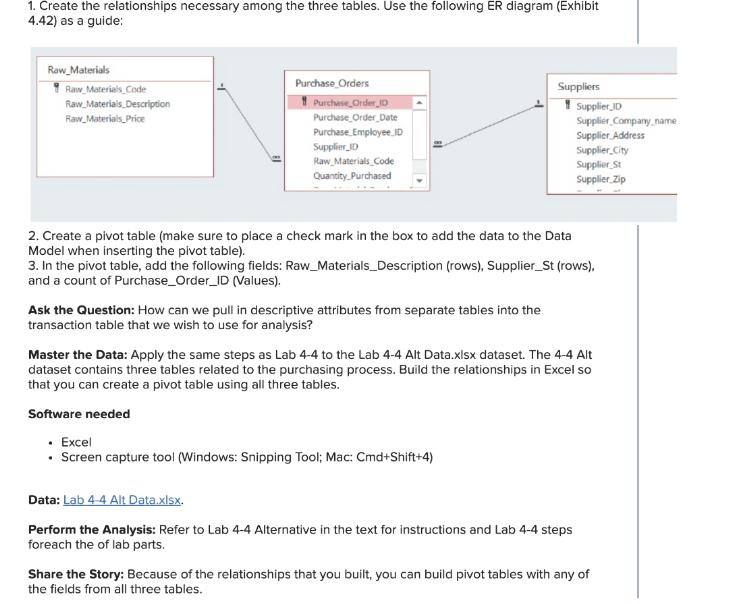
Question: 1. Create the relationships necessary among the three tables. Use the following ER diagram (Exhibit 4.42) as a guide: Raw_Materials Raw Materia's Code Raw


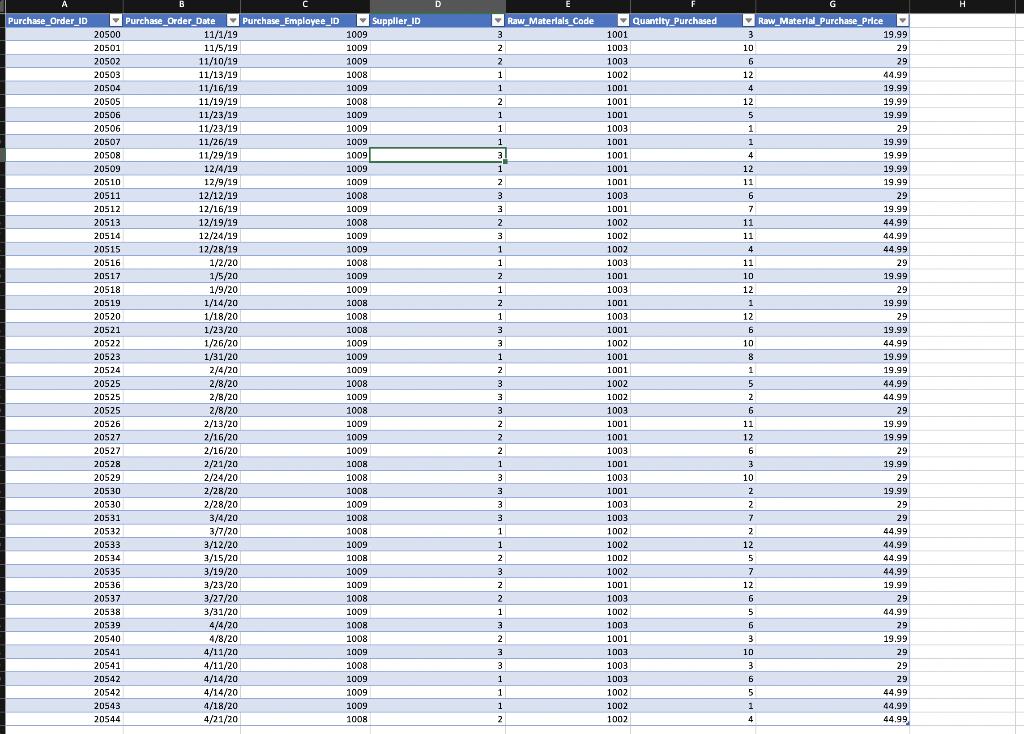
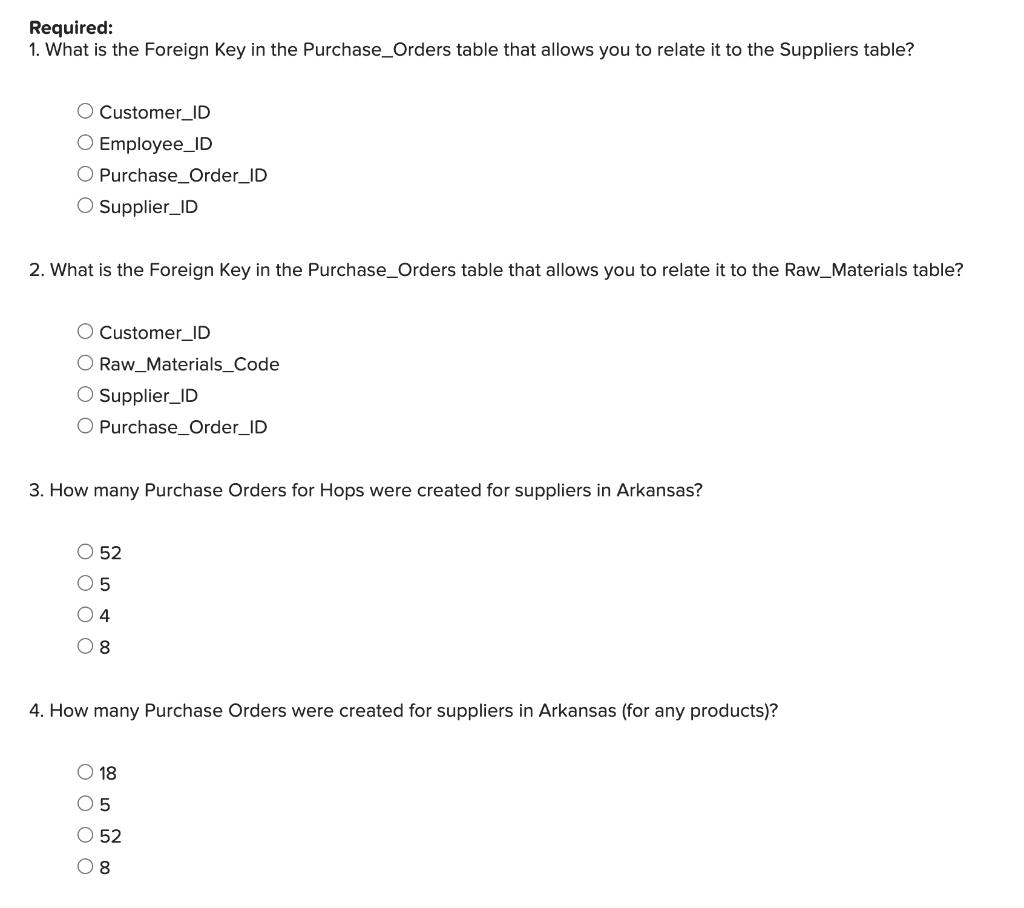
1. Create the relationships necessary among the three tables. Use the following ER diagram (Exhibit 4.42) as a guide: Raw_Materials Raw Materia's Code Raw Materials, Description Raw Materiais Price Purchase Orders Purchese Order D Purdhese Order Date Suppliers 1 Supplier ID Supplier Company name Supplier Address Supplier.City Supplier St Supplier. Zip Purchase Employee.ID Supplier D Raw Materials Code Quantity Purchased 2. Create a pivot table (make sure to place a check mark in the box to add the data to the Data Model when inserting the pivot table). 3. In the pivot table, add the following fields: Raw_Materials_Description (rows), Supplier_St (rows), and a count of Purchase_Order_ID (Values). Ask the Question: How can we pull in descriptive attributes from separate tables into the transaction table that we wish to use for analysis? Master the Data: Apply the same steps as Lab 4-4 to the Lab 4-4 Alt Data.xlsx dataset. The 4-4 Alt dataset contains three tables related to the purchasing process. Build the relationships in Excel so that you can create a pivot table using all three tables. Software needed Excel Screen capture tool (Windows: Snipping Tool; Mac: Cmd+Shift+4) Data: Lab 4-4 Alt Data.xlsx. Perform the Analysis: Refer to Lab 4-4 Alternative in the text for instructions and Lab 4-4 steps foreach the of lab parts. Share the Story: Because of the relationships that you built, you can build pivot tables with any of the fields from all three tables. H Purchase_Order_ID - Purchase_Order Date Purchase_Employee ID Suppller ID Raw Materlals Code Quantity Purchased Raw Materlal Purchase Price 20500 11/1/19 1009 3 1001 3 19,99 20501 11/5/19 11/10/19 1009 2 1003 10 29 20502 1009 1003 29 20503 11/13/19 1008 1 1002 12 44.99 20504 11/16/19 1009 1001 4 19.99 11/19/19 11/23/19 11/23/19 11/26/19 11/29/19 20505 1008 2 1001 12 19.99 20506 1009 1 1001 5 19.99 20506 1009 1 1003 29 20507 1009 1 1001 19.99 20508 1009 3 1 1001 4 19.99 12/4/19 12/9/19 20509 1009 1 1001 12 19.99 20510 1009 2 1001 11 19.99 12/12/19 12/16/19 12/19/19 20511 1008 3 1003 6 29 20512 1009 3 1001 7 19.99 20513 1008 1002 11 44.99 20514 12/24/19 1009 3. 1002 11 44.99 20515 12/28/19 1009 1 1002 4 44.99 20516 1/2/20 1008 1 1003 11 29 20517 1/5/20 1009 2 1001 10 19.99 20518 1/9/20 1009 1 1003 12 29 20519 1/14/20 1008 2 1001 1 19.99 20520 1/18/20 1008 1 1003 12 29 20521 1/23/20 1008 3 1001 6 19.99 20522 1/26/20 1009 3 1002 10 44.99 20523 1/31/20 1009 1 1001 8. 19.99 20524 2/4/20 1009 2 1001 1 19.99 20525 2/8/20 1008 3 1002 5 44.99 2/8/20 2/8/20 20525 1009 1002 2 44.99 20525 1008 3 1003 6 29 20526 2/13/20 1009 2 1001 11 19.99 20527 2/16/20 1009 2 1001 12 19.99 20527 2/16/20 1009 2 1003 6 29 20528 2/21/20 1008 1 1001 3 19.99 20529 2/24/20 1008 3 1003 10 29 2/28/20 2/28/20 20530 1008 3 1001 2 19.99 20530 1009 3 1003 2 29 20531 3/4/20 1008 3 1003 29 20532 3/7/20 1008 1 1002 2 44.99 20533 3/12/20 1009 1 1002 12 44.99 3/15/20 3/19/20 20534 1008 2 1002 5 44.99 20535 1009 3 1002 44.99 3/23/20 3/27/20 20536 1009 2 1001 12 19.99 20537 1008 1003 6. 29 3/31/20 4/4/20 20538 1009 1 1002 5 44.99 20539 1008 3 1003 29 20540 4/8/20 1008 2 1001 3 19.99 20541 4/11/20 1009 3 1003 10 29 20541 4/11/20 1008 3 1003 3 29 20542 4/14/20 1009 1 1003 29 20542 4/14/20 1009 1 1002 44.99 20543 4/18/20 1009 1 1002 1 44.99 20544 4/21/20 1008 2 1002 44.99 Required: 1. What is the Foreign Key in the Purchase_Orders table that allows you to relate it to the Suppliers table? O Customer_ID O Employee_ID O Purchase_Order_ID O Supplier_ID 2. What is the Foreign Key in the Purchase_Orders table that allows you to relate it to the Raw_Materials table? O Customer_ID O Raw_Materials_Code O Supplier_ID O Purchase_Order_ID 3. How many Purchase Orders for Hops were created for suppliers in Arkansas? O 52 O 5 O 4 8 0 4. How many Purchase Orders were created for suppliers in Arkansas (for any products)? O 18 O 5 O 52 O8 5. Change the PivotTable so that you see the sum of quantity purchased associated with each product and state. What was the quantity of hops purchased from suppliers in Minnesota? 28 42 344 50
Step by Step Solution
3.41 Rating (154 Votes )
There are 3 Steps involved in it
Answers to the questions 1 Supplier ID 2Raw material code 3 8 ... View full answer

Get step-by-step solutions from verified subject matter experts


