Answered step by step
Verified Expert Solution
Question
1 Approved Answer
Make a horizontal analysis of these income statements by comparing first between the three years of income statement (1), then compare it with the performance
Make a horizontal analysis of these income statements by comparing first between the three years of income statement (1), then compare it with the performance of income statement (2). Your analysis should be detailed as you'll have to write two well-developed paragraphs.
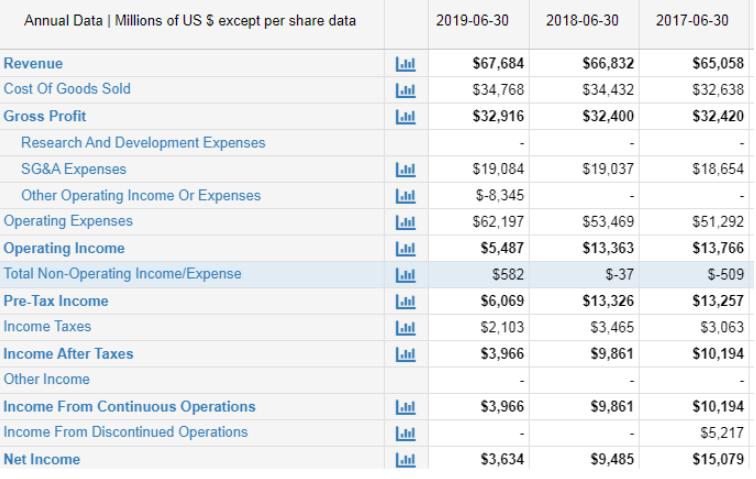
Income statement 1

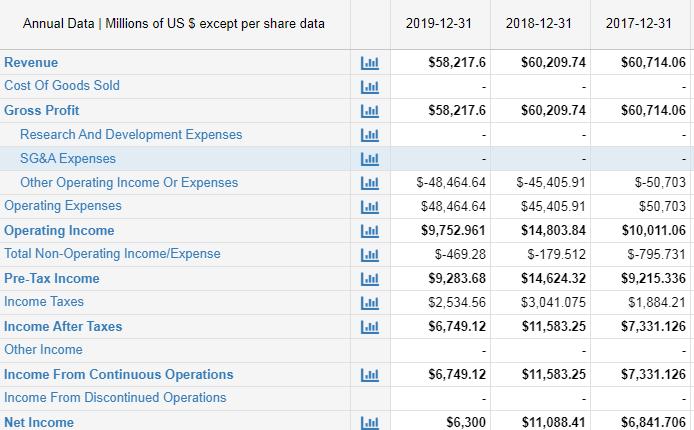
Income statement 2

Annual Data | Millions of US 5 except per share data 2019-06-30 2018-06-30 2017-06-30 Revenue Llal $67,684 $66,832 $65,058 Cost Of Goods Sold Lal $34,768 $34,432 $32,638 Gross Profit Lal $32,916 $32,400 $32,420 Research And Development Expenses SG&A Expenses Lal $19,084 $19,037 $18,654 Other Operating Income Or Expenses $-8,345 Operating Expenses Lal $62,197 $53,469 $51,292 Operating Income Llal $5,487 $13,363 $13,766 Total Non-Operating Income/Expense Lal $582 $-37 S-509 Pre-Tax Income Lal $6,069 $13,326 $13,257 Income Taxes $2,103 $3,465 53,063 Income After Taxes Lal $3,966 $9,861 $10,194 Other Income Income From Continuous Operations Lal $3,966 $9,861 $10,194 Income From Discontinued Operations Lal $5,217 Net Income Lal $3,634 $9,485 $15,079
Step by Step Solution
★★★★★
3.32 Rating (158 Votes )
There are 3 Steps involved in it
Step: 1

Get Instant Access to Expert-Tailored Solutions
See step-by-step solutions with expert insights and AI powered tools for academic success
Step: 2

Step: 3

Ace Your Homework with AI
Get the answers you need in no time with our AI-driven, step-by-step assistance
Get Started


