Answered step by step
Verified Expert Solution
Question
1 Approved Answer
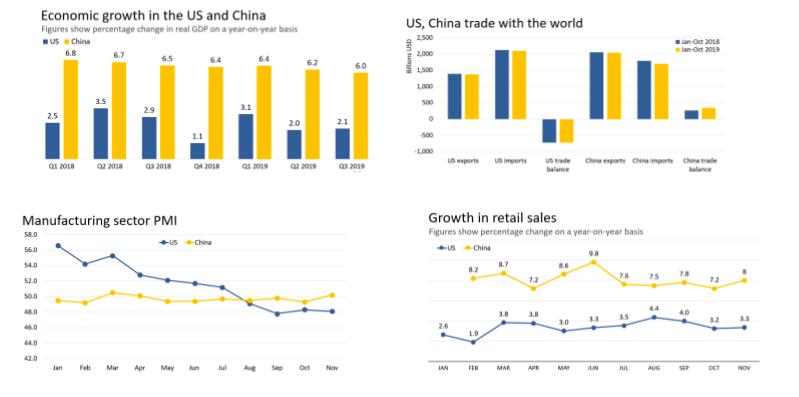
The trade war entered its second year in 2019. increasingly weighing on both economies amid worsening business sentiment globally. Here are the charts that


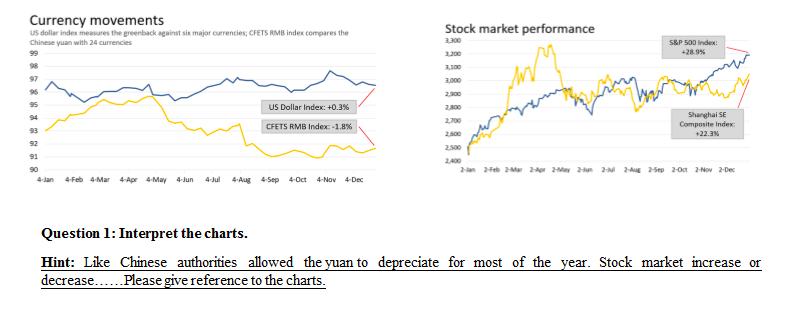
The trade war entered its second year in 2019. increasingly weighing on both economies amid worsening business sentiment globally. Here are the charts that look at how the world's top two economies (US and China) and their financial markets have performed in the year. Economic growth in the US and China Figures shaw percentage change in real GDP on a year-on year basis US, China trade with the world 2.500 US China an Ot 2018 lan-Ort 2019 6.8 6.7 2,000 6.5 64 1500 3.5 s00 31 29 2.5 2.0 21 500 uS trede Chine enparts O imports Chna trade halance Us enporte usimporte Q1 2018 a2 2018 as 2014 as 2019 as 201 a 2019 alance Manufacturing sector PMI Growth in retail sales 58.0 Figures show percentage change on a year-on-year basis -China US China 54.0 8.2 76 75 52.0 7.2 s0.0 44 48.0 4.0 3.0 3. AS 3.0 32 2.6 1.9 44.0 42.0 Jan Feb Mar Apr May Nov JAN FER MAR APE MA JUL AUG SEP NOV Currency movements us dollar indes measures the greenback against sin major currencies; CFETS RMB index compares the Chinese yuan with 24 currencies Stock market performance S&P 500 ndex: 99 100 +289% 98 1,100 97 1000 96 2.300 95 US Dollar Index: +0.3% 200 Shanghai SE Composite Index: 94 CFETS RMB Index: -1.8% 93 2500 +22.3% 92 2500 91 an ata -Aer a un Ag 5p 20n 2Nov 2-Dec 90 4-lan 4Feb 4-Mar 4-Apr 4-May 4-Jun 4-Jul 4-Aug 4Sep 4-Oct 4-Nov 4-Dec Question 1: Interpret the charts. Hint: Like Chinese authorities allowed the yuan to depreciate for most of the year. Stock market increase or decrease..Please give reference to the charts.
Step by Step Solution
★★★★★
3.53 Rating (160 Votes )
There are 3 Steps involved in it
Step: 1
Answer With reference to the charts 1 Economic growth slows Growth in gross domestic prod...
Get Instant Access to Expert-Tailored Solutions
See step-by-step solutions with expert insights and AI powered tools for academic success
Step: 2

Step: 3

Ace Your Homework with AI
Get the answers you need in no time with our AI-driven, step-by-step assistance
Get Started


