Answered step by step
Verified Expert Solution
Question
1 Approved Answer
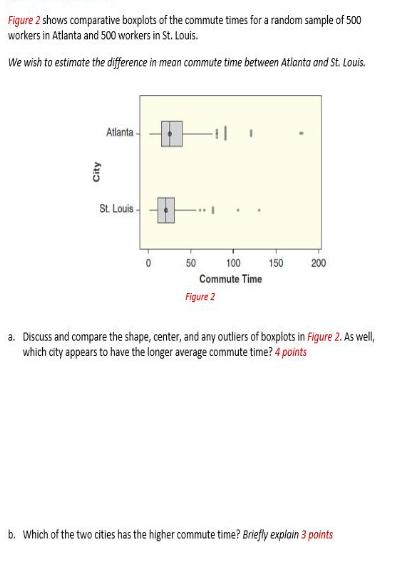
Figure 2 shows comparative boxplots of the commute times for a random sample of 500 workers in Atlanta and 500 workers in St. Louis.


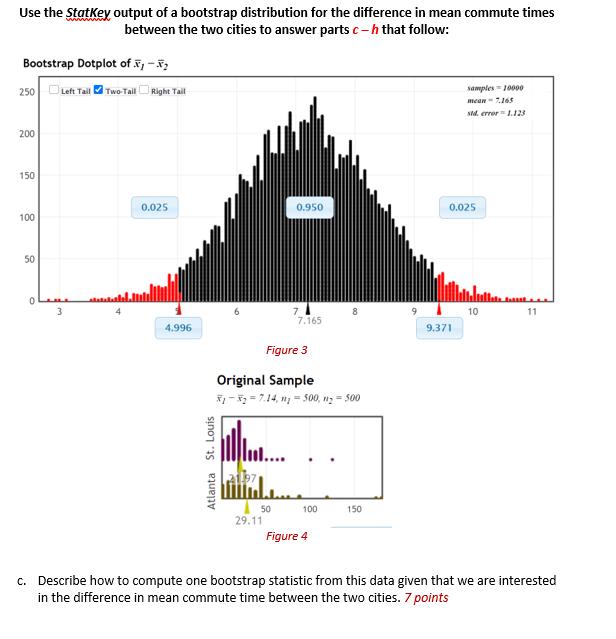
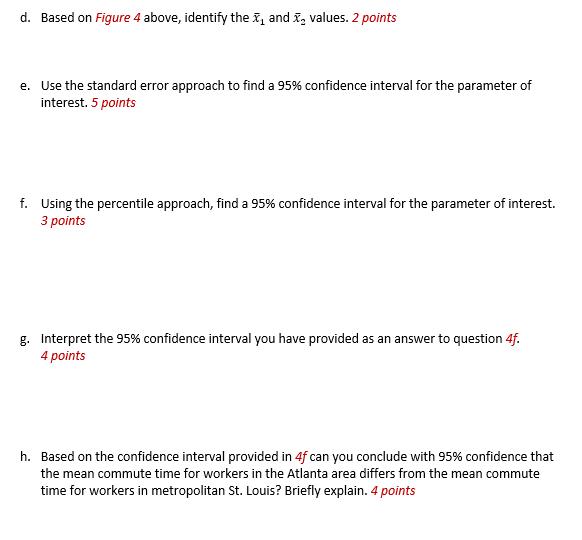
Figure 2 shows comparative boxplots of the commute times for a random sample of 500 workers in Atlanta and 500 workers in St. Louis. We wish to estimate the difference in mean commute time between Atlanta and St. Louis. City Atlanta St. Louis 0 50 1 Figure 2 100 150 Commute Time 200 a. Discuss and compare the shape, center, and any outliers of boxplots in Figure 2. As well, which city appears to have the longer average commute time? 4 points b. Which of the two cities has the higher commute time? Briefly explain 3 points Use the StatKey output of a bootstrap distribution for the difference in mean commute times between the two cities to answer parts c-h that follow: Bootstrap Dotplot of - 250 Left Tail Two-Tail 200 150 100 50 0 3 Right Tail 0.025 4.996 Atlanta St. Louis 0.950 50 7 7.165 Figure 3 Original Sample 1-3-7.14, n=500, 500 ... 29.11 100 8 Figure 4 150 samples-10000 mean 7.165 sid. error 1.123 0.025 9.371 10 11 c. Describe how to compute one bootstrap statistic from this data given that we are interested in the difference in mean commute time between the two cities. 7 points d. Based on Figure 4 above, identify the and values. 2 points e. Use the standard error approach to find a 95% confidence interval for the parameter of interest. 5 points f. Using the percentile approach, find a 95% confidence interval for the parameter of interest. 3 points g. Interpret the 95% confidence interval you have provided as an answer to question 4f. 4 points h. Based on the confidence interval provided in 4f can you conclude with 95% confidence that the mean commute time for workers in the Atlanta area differs from the mean commute time for workers in metropolitan St. Louis? Briefly explain. 4 points
Step by Step Solution
★★★★★
3.34 Rating (160 Votes )
There are 3 Steps involved in it
Step: 1
Solution Part a The city Atlanta appears to have longer commute time due ...
Get Instant Access to Expert-Tailored Solutions
See step-by-step solutions with expert insights and AI powered tools for academic success
Step: 2

Step: 3

Ace Your Homework with AI
Get the answers you need in no time with our AI-driven, step-by-step assistance
Get Started


