

Question: The table below contains data on the monthly amount, in millions of dollars, which was spent by leading national advertisers for advertising apparel and accessories
The table below contains data on the monthly amount, in millions of dollars, which was spent by "leading national advertisers" for advertising apparel and accessories in magazines, in four recent years. 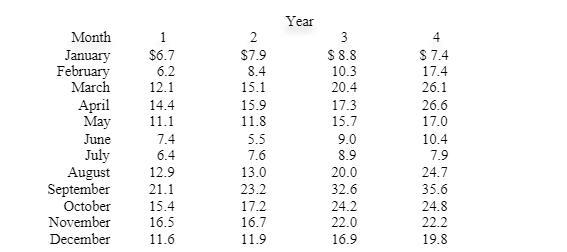
Source: Survey of Current Business, U.S. Department of Commerce, Washington, D.C., various dates. Use the above data to complete the following: a. Construct the worksheet for single-factor exponential smoothing with 0.20 to obtain the forecasts for the months of February through December of Year
1. Assume that the forecast for January of Year 1 is the same as the actual for January of Year 1.
b. Draw the graph of the actual values and the forecasted values for both 0.20 & 0.80
c. Explain the graph with references to the difference of 0.20 and 0.80 alphas
Year Month 1 3 4 $8.8 10.3 $ 7.4 $6.7 January February March April May June July August September October November $7.9 6.2 8.4 17.4 15.1 15.9 12.1 20.4 26.1 17.3 15.7 14.4 26.6 11.1 11.8 17.0 7.4 5.5 9.0 10.4 6.4 7.6 8.9 7.9 12.9 13.0 20.0 24.7 21.1 23.2 32.6 35.6 15.4 17.2 24.2 24.8 16.5 16.7 22.0 22.2 December 11.6 11.9 16.9 19.8 211 2.
Step by Step Solution
3.58 Rating (162 Votes )
There are 3 Steps involved in it

Get step-by-step solutions from verified subject matter experts