Question
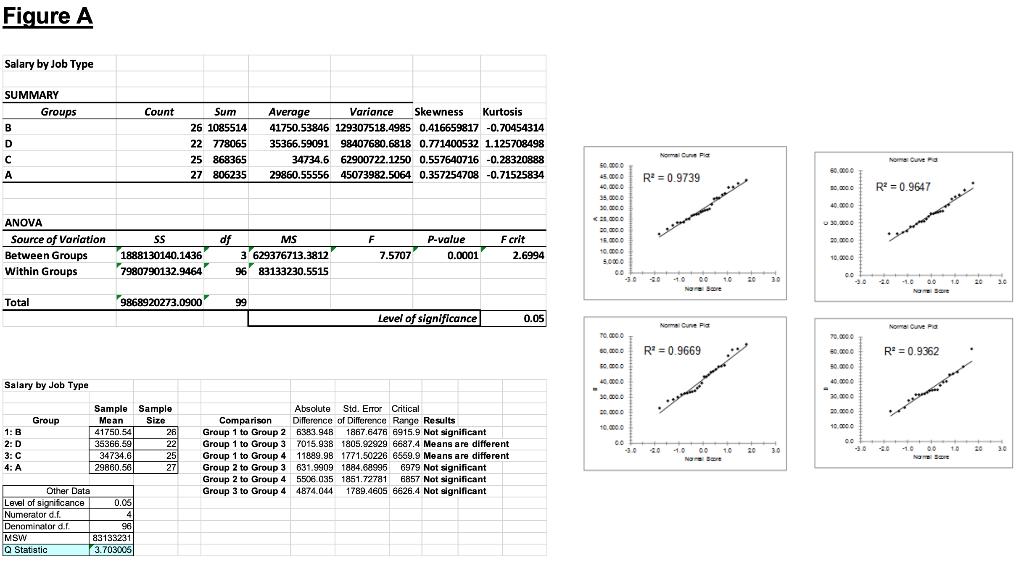
You have a random sample of average salaries for various jobs for 100 organizations in the manufacturing sector. Each job is classified as type A,B,C,D:A:
You have a random sample of average salaries for various jobs for 100 organizations in the manufacturing sector. Each job is classified as type A,B,C,D:A: Production Workers
B: Purchasing Agents
C: Inspectors, testors, sorters, samplers and weighers
D: Machinists
You wish to determine whether there is a relationship between average salary and job type (i.e. are the population mean salaries are equal for the 4 different job types). Use the results above for the next four parts:
a) Set up a hypothesis and write up a statement of how confident you are that some population mean salaries are different.
b) Explain if your results are valid and reliable, and if not, what can you conclude (hint: check two assumptions!).
c) Is it important that the data be from a random sample? What could be the problem if it were not?
d) Use the Tukey pairwise comparisons to help you write up a series of statements detailing which job types have higher population mean average salaries than others with at least 95% confidence.

Figure A Salary by Job Type SUMMARY Groups Count Sum Average Variance Skewness Kurtosis 26 1085514 41750.53846 129307518.4985 0.416659817 -0.70454314 D 22 778065 35366.59091 98407680.6818 0.771400532 1.125708498 Normal Cure Pia 25 868365 27 806235 34734.6 62900722.1250 0.557640716 -0.28320888 Noma Cuve Pa 50. 000.0 45. 0000 40. 0000 35, 000.0 60.0000 A 29860.55556 45073982.5064 0.357254708 -0.71525834 R = 0.9739 R = 0.9647 10,0000 40.0000 20. 000.0 ANOVA 30.0000 Source of Variation Between Groups df 1888130140.1436 7980790132.9464 MS P-value Fcrit 15. 00.0 20,0000 10. 000 3' 629376713.3812 96 83133230.5515 7.5707 0.0001 2.6994 10.000 0 5.000.0 Within Groups 10 10 30 1.0 00 1.0 20 2.0 Ng Sore Na Sare Total 9868920273.0900" 66 Level of significance 0.05 Nomai Curve Pa Noma Cuve Pa 70.0000 R = 0.9669 R = 0.9362 50.0000 30.0000 40.0000 Salary by Job Type 30. 000.0 20.0000 ..... Sample Sample Absolute Std. Error Critical 20. 0000 20.0000 Comparison Group 1 to Group 2 6383.94B 1867.6476 6915.9 Not significant Group 1 to Group 3 7015.938 1805.92929 6687.4 Means are different Group 1 to Group 4 11889.98 1771.50226 6559.9 Means are different Group 2 to Group 3 631.9909 1884.68995 6979 Not significant Group 2 to Group 4 5506.035 1851.72781 6857 Not significant Group 3 to Group 4 4874.044 Group Mean Size Difference of Difference Range Results 10.000.0 10.0000 26 22 25 27 1: B 41750.54 2: D 35366.59 -3.0 10 00 10 20 30 1.0 10 20 30 3: C 34734.6 Na Bare Na Sare 4: A 29860.56 Other Data 1789.4605 6626.4 Not significant Level of significance Numerator d.f. Denominator d.f. MSW Q Statistic 0.05 96 83133231 3.703005
Step by Step Solution
3.33 Rating (144 Votes )
There are 3 Steps involved in it
Step: 1
a The hypothesis being tested is Null Hypothesis Ho H1 P2 H3 H4 Alternative ...
Get Instant Access to Expert-Tailored Solutions
See step-by-step solutions with expert insights and AI powered tools for academic success
Step: 2

Step: 3

Ace Your Homework with AI
Get the answers you need in no time with our AI-driven, step-by-step assistance
Get Started


