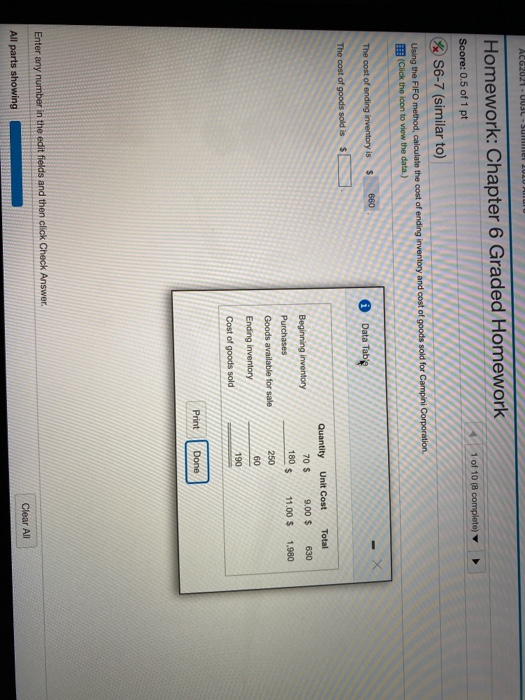
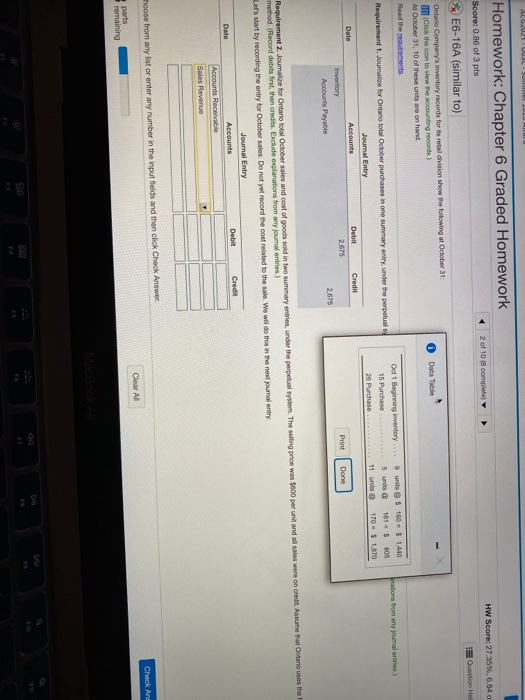
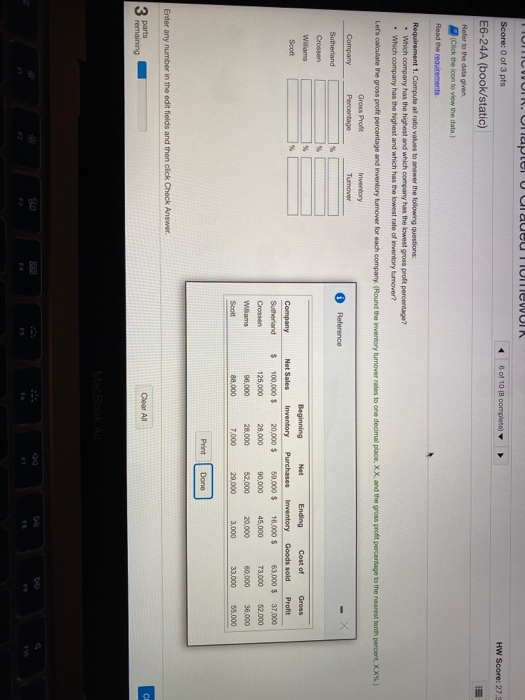
ACG2021 - UUSL - summe Homework: Chapter 6 Graded Homework 1 of 10 (8 complete) Score: 0.5 of 1 pt S6-7 (similar to) Using the FIFO method, calculate the cost of ending inventory and cost of goods sold for Campini Corporation (Click the icon to view the data) 660 The cost of ending inventory is Data Table The cost of goods sold is $ Beginning inventory Purchases Goods available for sale Quantity Unit Cost Total 70 $ 9.00 $ 630 180 $ 11.00 $ 1.980 250 60 Ending inventory 190 Cost of goods sold Print Done Enter any number in the edit fields and then click Check Answer Clear All All parts showing ALGW-UUSL - SUN TULUI Homework: Chapter 6 Graded Homework HW Score: 27.35%, 6.84 2 of 10 ( completely Score: 0.86 of 3 pts Question Hel E6-16A (similar to) On Company's inventory records for its retail division show the following at October 31 Click the icon to view the accounting records) Al October 31, 10 of these units are on hand. Data Table Read the requirements rations from any jumaleries) Oct 1 Beginning inventory... 15 Purchase 26 Purchase 9 units @ 100 1440 5 units 161 - S 305 11 170 $ 1870 Requirement 1. Joumalize for Ontario total October purchases in one summary entry under the perpetual Journal Entry Date Accounts Debit Credit Inventory 2.675 Accounts Payable 2,675 Print Done Requirement 2. Journalize for Ontario totalOctober sales and cost of goods sold in two summary entries, under the perpetual system. The selling price was $600 per unit and all sales were on credit. Assume that Ontarios the method (Record debits first, then credits. Exclude explanations from any journal entries) Let's start by recording the entry for October sales. Do not yet record the cost related to the sale. We will do this in the next jouma entry Journal Entry Date Accounts Debit Credit Accounts Receivable Sales Revenue hoose from any list or enter any number in the input fields and then click Check Answer Check And Clear Al parts remaining 20 6 of 10 ( completo) HW Score: 27.2 IUNTIL WUR. Unap U UlauUU TUMEWUIK Score: 0 of 3 pts E6-24A (book/static) Refer to the data given (Click the icon to view the data) Read the requirements Requirement 1. Computea ratio values for the following questions: Which company has the highest and which company has the lowest gross proft percentago? Which company has the highest and which has the lowest rate of inventory turnover? Let's calculate the gross proft percentage and inventory tumover for each company. (Round the inventory tumover rates to one decimal place, XX, and the gross profit percentage to the nearestat percent, XX%) Gross Profit Inventory Company Percentage Tumover Reference - Sutherland Crossen Williams Beginning Net Ending Cost of Gross Scott % Company Net Sales Inventory Purchases Inventory Goods sold Profit Sutherland $ 100,000 $ 20,000 $ 59,000 $ 16,000 $ 63 000 $ 37,000 Crossen 125,000 90,000 45,000 73,000 52.000 Williams 96,000 28.000 52.000 20.000 60,000 36,000 Scott 88,000 7.000 29.000 3,000 33,000 55.000 28.000 Print Dono Enter any number in the edit fields and then click Check Answer. 3 C parts remaining Clear All MacBc


