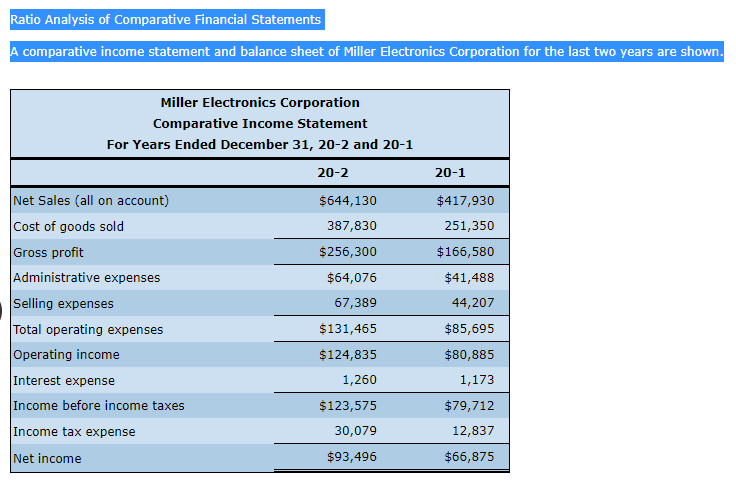
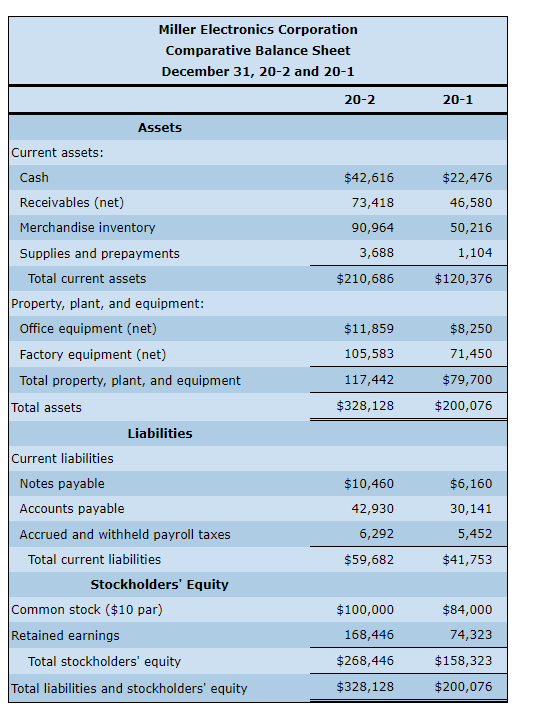
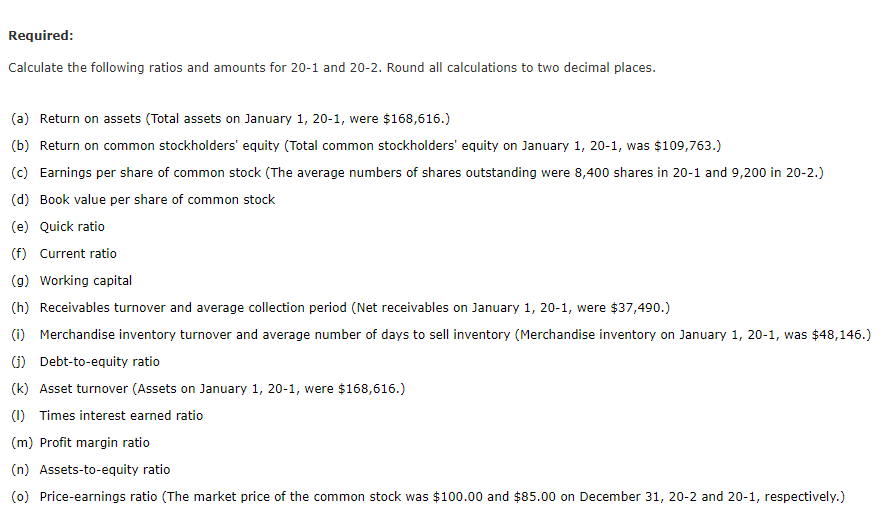
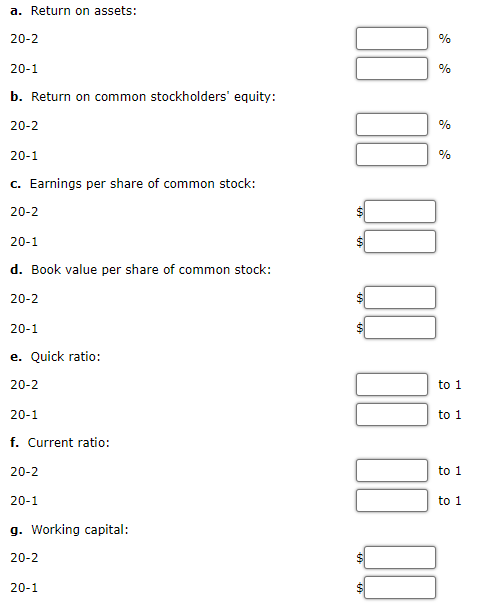
Acomparative income statement and balance sheet of Miller Bectronics corroration for the last two years are shown. Calculate the following ratios and amounts for 201 and 20-2. Round all calculations to two decimal places. (a) Return on assets (Total assets on January 1,201, were $168,616. ) (b) Return on common stockholders' equity (Total common stockholders' equity on January 1,201, was $109,763. ) (c) Earnings per share of common stock (The average numbers of shares outstanding were 8,400 shares in 20-1 and 9,200 in 20-2.) (d) Book value per share of common stock (e) Quick ratio (f) Current ratio (g) Working capital (h) Receivables turnover and average collection period (Net receivables on January 1,201, were $37,490.) (i) Merchandise inventory turnover and average number of days to sell inventory (Merchandise inventory on January 1 , 20-1, was $48,146. (j) Debt-to-equity ratio (k) Asset turnover (Assets on January 1, 20-1, were $168,616. ) (I) Times interest earned ratio (m) Profit margin ratio (n) Assets-to-equity ratio (o) Price-earnings ratio (The market price of the common stock was $100.00 and $85.00 on December 31 , 202 and 20 - 1 , respectively.) a. Return on assets: 202 201 b. Return on common stockholders' equity: 202 201 c. Earnings per share of common stock: 202 201 d. Book value per share of common stock: 202 20-1 e. Quick ratio: 20-2 20-1 to 1 f. Current ratio: to 1 202 20-1 to 1 g. Working capital: 20-2 to 1 20-1 h. Receivables turnover: 202 to 1 201 to 1 Average collection period: 202 201 days i. Merchandise inventory turnover: days 20-2 201 to 1 Average number of days to sell inventory: to 1 20-2 201 days j. Debt-to-equity ratio: 202 20-1 days k. Asset turnover: 20-2 20-1 to 1 to 1 I. Times interest earned ratio: 20-2 to 1 to 1 20-1 times m. Profit margin ratio: times 20-2 20-1 % % n. Assets-to-equity ratio: 20-2 201 o. Price-earnings ratio: 202 20-1 Acomparative income statement and balance sheet of Miller Bectronics corroration for the last two years are shown. Calculate the following ratios and amounts for 201 and 20-2. Round all calculations to two decimal places. (a) Return on assets (Total assets on January 1,201, were $168,616. ) (b) Return on common stockholders' equity (Total common stockholders' equity on January 1,201, was $109,763. ) (c) Earnings per share of common stock (The average numbers of shares outstanding were 8,400 shares in 20-1 and 9,200 in 20-2.) (d) Book value per share of common stock (e) Quick ratio (f) Current ratio (g) Working capital (h) Receivables turnover and average collection period (Net receivables on January 1,201, were $37,490.) (i) Merchandise inventory turnover and average number of days to sell inventory (Merchandise inventory on January 1 , 20-1, was $48,146. (j) Debt-to-equity ratio (k) Asset turnover (Assets on January 1, 20-1, were $168,616. ) (I) Times interest earned ratio (m) Profit margin ratio (n) Assets-to-equity ratio (o) Price-earnings ratio (The market price of the common stock was $100.00 and $85.00 on December 31 , 202 and 20 - 1 , respectively.) a. Return on assets: 202 201 b. Return on common stockholders' equity: 202 201 c. Earnings per share of common stock: 202 201 d. Book value per share of common stock: 202 20-1 e. Quick ratio: 20-2 20-1 to 1 f. Current ratio: to 1 202 20-1 to 1 g. Working capital: 20-2 to 1 20-1 h. Receivables turnover: 202 to 1 201 to 1 Average collection period: 202 201 days i. Merchandise inventory turnover: days 20-2 201 to 1 Average number of days to sell inventory: to 1 20-2 201 days j. Debt-to-equity ratio: 202 20-1 days k. Asset turnover: 20-2 20-1 to 1 to 1 I. Times interest earned ratio: 20-2 to 1 to 1 20-1 times m. Profit margin ratio: times 20-2 20-1 % % n. Assets-to-equity ratio: 20-2 201 o. Price-earnings ratio: 202 20-1


