Answered step by step
Verified Expert Solution
Question
1 Approved Answer
Activity 3 . 2 . 3 Measuring job satisfaction If this item does not open automatically you can open Activity 3 . 2 . 3
Activity Measuring job satisfaction
If this item does not open automatically you can open Activity Measuring job satisfaction here
Click to Launch
Companies often ask exemployees to rate their previous company of employment in order to gauge levels of job satisfaction. In this activity, you
will use statistics to interpret the ratings of such a group of exemployees.
Refer to the information provided below to complete this activity.
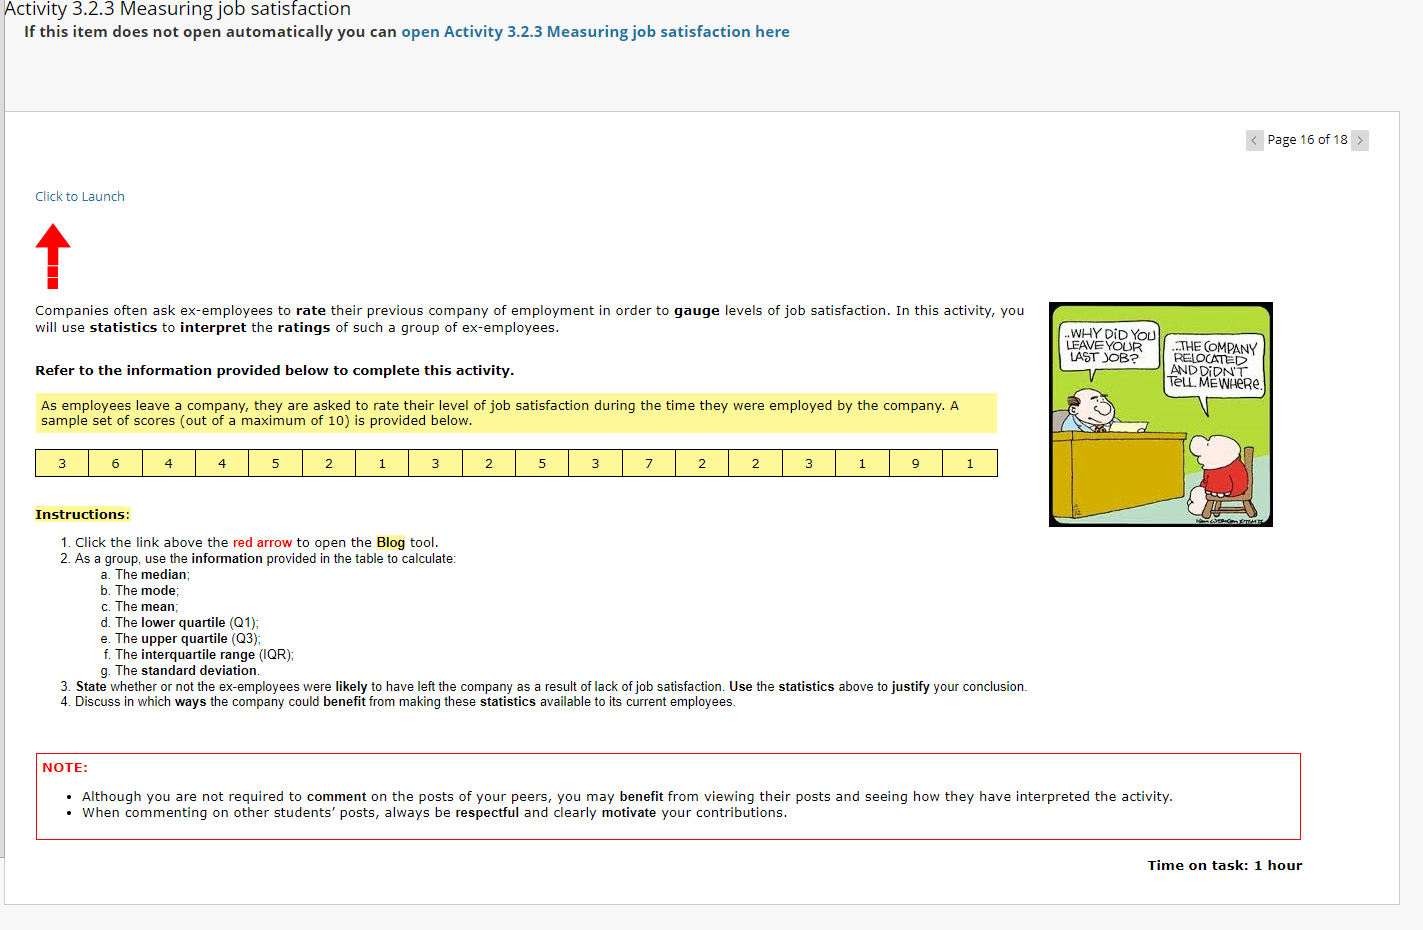
As employees leave a company, they are asked to rate their level of job satisfaction during the time they were employed by the company. A
sample set of scores out of a maximum of is provided below.
Instructions:
Click the link above the red arrow to open the Blog tool.
As a group, use the information provided in the table to calculate:
a The median;
b The mode;
c The mean;
d The lower quartile Q;
e The upper quartile Q;
f The interquartile range IQR;
g The standard deviation.
State whether or not the exemployees were likely to have left the company as a result of lack of job satisfaction. Use the statistics above to justify your conclusion.
Discuss in which ways the company could benefit from making these statistics available to its current employees.
NOTE:
Although you are not required to comment on the posts of your peers, you may benefit from viewing their posts and seeing how they have interpreted the activity.
When commenting on other students' posts, always be respectful and clearly motivate your contributions.CAN YOU PLEASE ASSIST WITH MY QUANTATATIVE TECHNIQUES HOMEWORKActivity Measuring job satisfaction
If this item does not open automatically you can open Activity Measuring job satisfaction here
Click to Launch
Companies often ask exemployees to rate their previous company of employment in order to gauge levels of job satisfaction. In this activity, you
will use statistics to interpret the ratings of such a group of exemployees.
Refer to the information provided below to complete this activity.
As employees leave a company, they are asked to rate their level of job satisfaction during the time they were employed by the company. A
sample set of scores out of a maximum of is provided below.
Instructions:
Click the link above the red arrow to open the Blog tool.
As a group, use the information provided in the table to calculate:
a The median;
b The mode;
c The mean;
d The lower quartile Q;
e The upper quartile Q;
f The interquartile range IQR;
g The standard deviation.
State whether or not the exemployees were likely to have left the company as a result of lack of job satisfaction. Use the statistics above to justify your conclusion.
Discuss in which ways the company could benefit from making these statistics available to its current employees.
NOTE:
Although you are not required to comment on the posts of your peers, you may benefit from viewing their posts and seeing how they have interpreted the activity.
When commenting on other students' posts, always be respectful and clearly motivate your contributions.

Step by Step Solution
There are 3 Steps involved in it
Step: 1

Get Instant Access to Expert-Tailored Solutions
See step-by-step solutions with expert insights and AI powered tools for academic success
Step: 2

Step: 3

Ace Your Homework with AI
Get the answers you need in no time with our AI-driven, step-by-step assistance
Get Started


