

Answered step by step
Verified Expert Solution
Question
1 Approved Answer
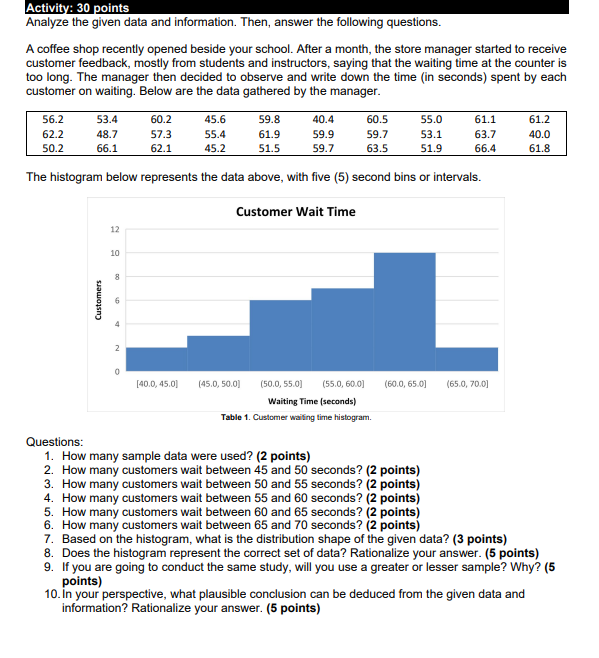
Activity: 30 points Analyze the given data and information. Then, answer the following questions. A coffee shop recently opened beside your school. After a month,
Step by Step Solution
There are 3 Steps involved in it
Step: 1

Get Instant Access to Expert-Tailored Solutions
See step-by-step solutions with expert insights and AI powered tools for academic success
Step: 2

Step: 3
Ace Your Homework with AI
Get the answers you need in no time with our AI-driven, step-by-step assistance
Get Started
Probability And Statistical Inference
Authors: Robert V. Hogg, Elliot Tanis, Dale Zimmerman
10th Edition
013518939X, 978-0135189399