

Answered step by step
Verified Expert Solution
Question
1 Approved Answer
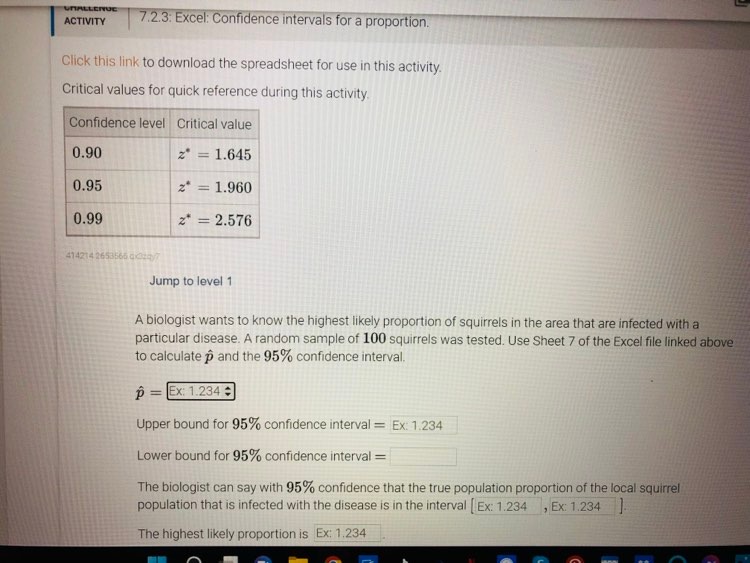
ACTIVITY 7.2.3: Excel: Confidence intervals for a proportion. Click this link to download the spreadsheet for use in this activity. Critical values for quick reference
Step by Step Solution
There are 3 Steps involved in it
Step: 1

Get Instant Access to Expert-Tailored Solutions
See step-by-step solutions with expert insights and AI powered tools for academic success
Step: 2

Step: 3
Ace Your Homework with AI
Get the answers you need in no time with our AI-driven, step-by-step assistance
Get Started
A Cp-Theory Problem Book Functional Equivalencies
Authors: Vladimir V Tkachuk
1st Edition
3319243853, 9783319243856