Answered step by step
Verified Expert Solution
Question
1 Approved Answer
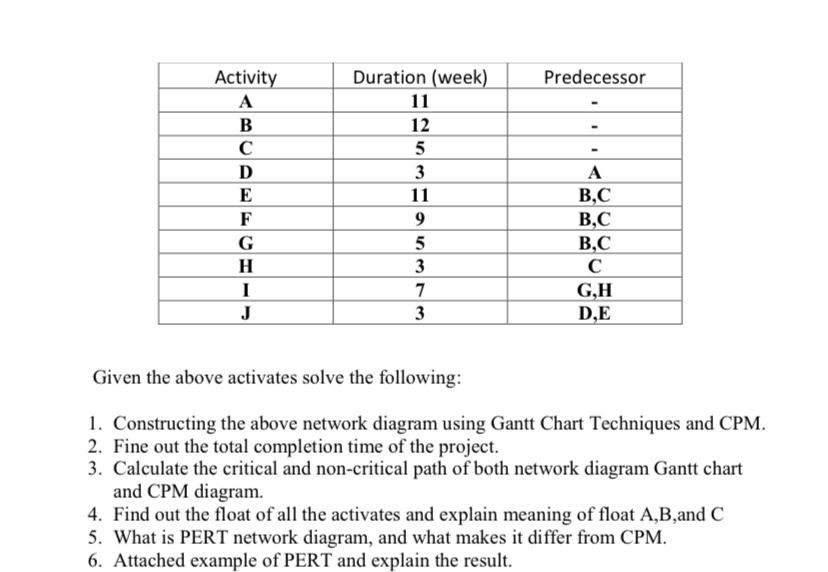
Activity A Duration (week) Predecessor B 11 12 C 5 3 A E 11 B,C F 9 B,C G 5 B,C H 3 I

Activity A Duration (week) Predecessor B 11 12 C 5 3 A E 11 B,C F 9 B,C G 5 B,C H 3 I 7 G,H J 3 D,E Given the above activates solve the following: 1. Constructing the above network diagram using Gantt Chart Techniques and CPM. 2. Fine out the total completion time of the project. 3. Calculate the critical and non-critical path of both network diagram Gantt chart and CPM diagram. 4. Find out the float of all the activates and explain meaning of float A,B,and C 5. What is PERT network diagram, and what makes it differ from CPM. 6. Attached example of PERT and explain the result.
Step by Step Solution
There are 3 Steps involved in it
Step: 1

Get Instant Access to Expert-Tailored Solutions
See step-by-step solutions with expert insights and AI powered tools for academic success
Step: 2

Step: 3

Ace Your Homework with AI
Get the answers you need in no time with our AI-driven, step-by-step assistance
Get Started


