

Answered step by step
Verified Expert Solution
Question
1 Approved Answer
Activity Chat Teams S2.pdf Q Search Close Please see last 3 years ratios and financial data of a company below. You are required to
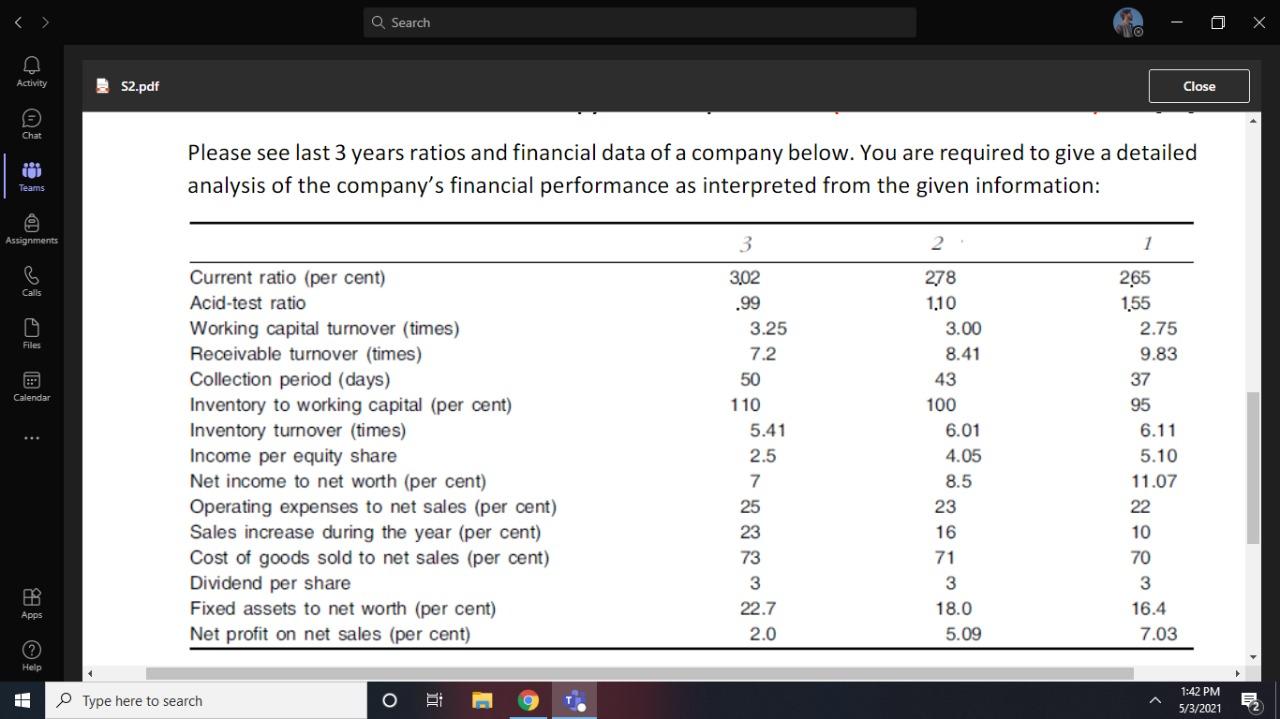
Activity Chat Teams S2.pdf Q Search Close Please see last 3 years ratios and financial data of a company below. You are required to give a detailed analysis of the company's financial performance as interpreted from the given information: Assignments 3 2 1 Current ratio (per cent) 3,02 278 265 Calls Acid-test ratio .99 1,10 1,55 Working capital turnover (times) 3.25 3.00 2.75 Files Receivable turnover (times) 7.2 8.41 9.83 Collection period (days) 50 43 37 Calendar Inventory to working capital (per cent) 110 100 95 Inventory turnover (times) 5.41 6.01 6.11 PR Apps Income per equity share Net income to net worth (per cent) Operating expenses to net sales (per cent) Sales increase during the year (per cent) Cost of goods sold to net sales (per cent) Dividend per share Fixed assets to net worth (per cent) Net profit on net sales (per cent) 272 223 22 2.5 4.05 8.5 55 5.10 11.07 23 22 16 10 71 70 3 3 22.7 18.0 16.4 2.0 5.09 7.03 Help Type here to search 1:42 PM 5/3/20212
Step by Step Solution
There are 3 Steps involved in it
Step: 1

Get Instant Access to Expert-Tailored Solutions
See step-by-step solutions with expert insights and AI powered tools for academic success
Step: 2

Step: 3
Ace Your Homework with AI
Get the answers you need in no time with our AI-driven, step-by-step assistance
Get Started
Investments Analysis and Management
Authors: Charles P. Jones
12th edition
978-1118475904, 1118475909, 1118363299, 978-1118363294