Activity: Students experience tremendous levels of stress throughout their education. A high level of stress may have a negative effect on the cognitive functioning and
Activity:
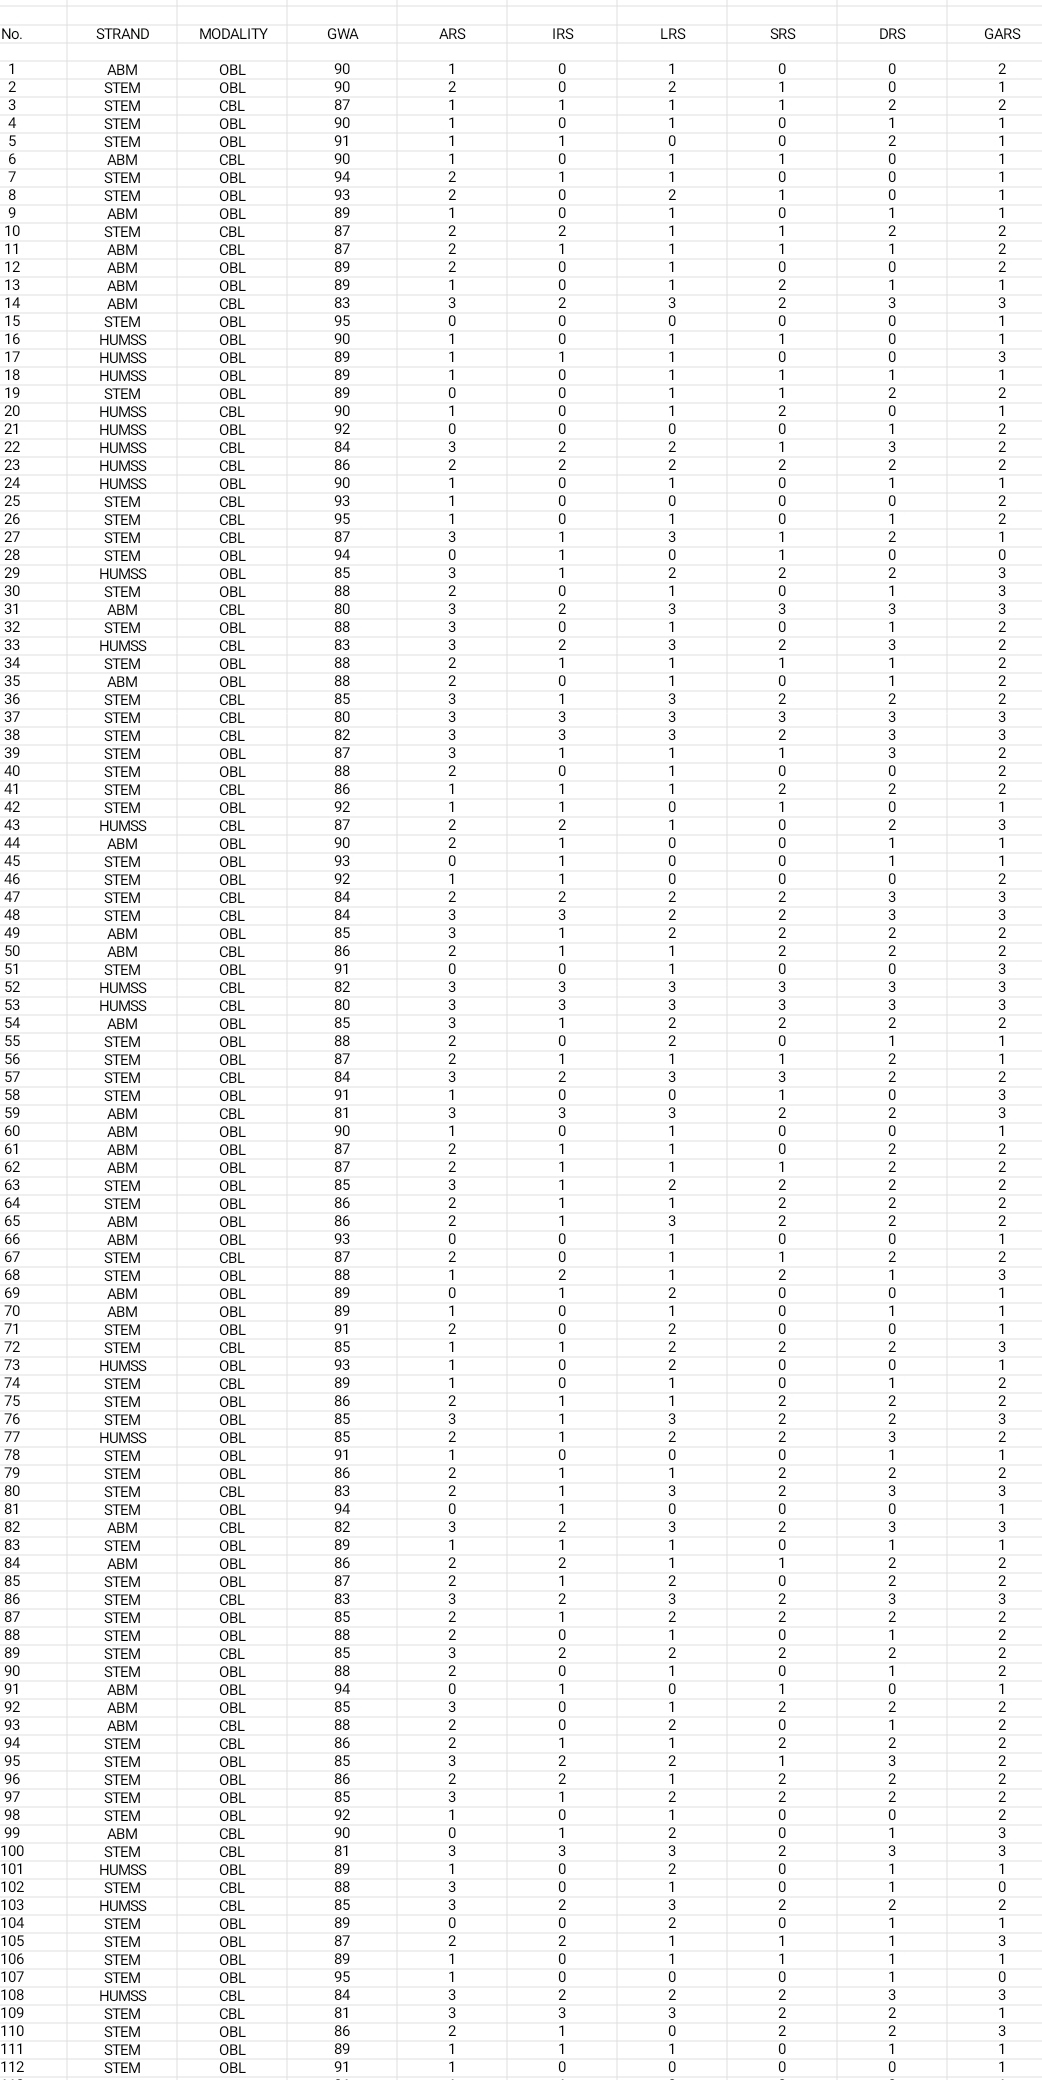
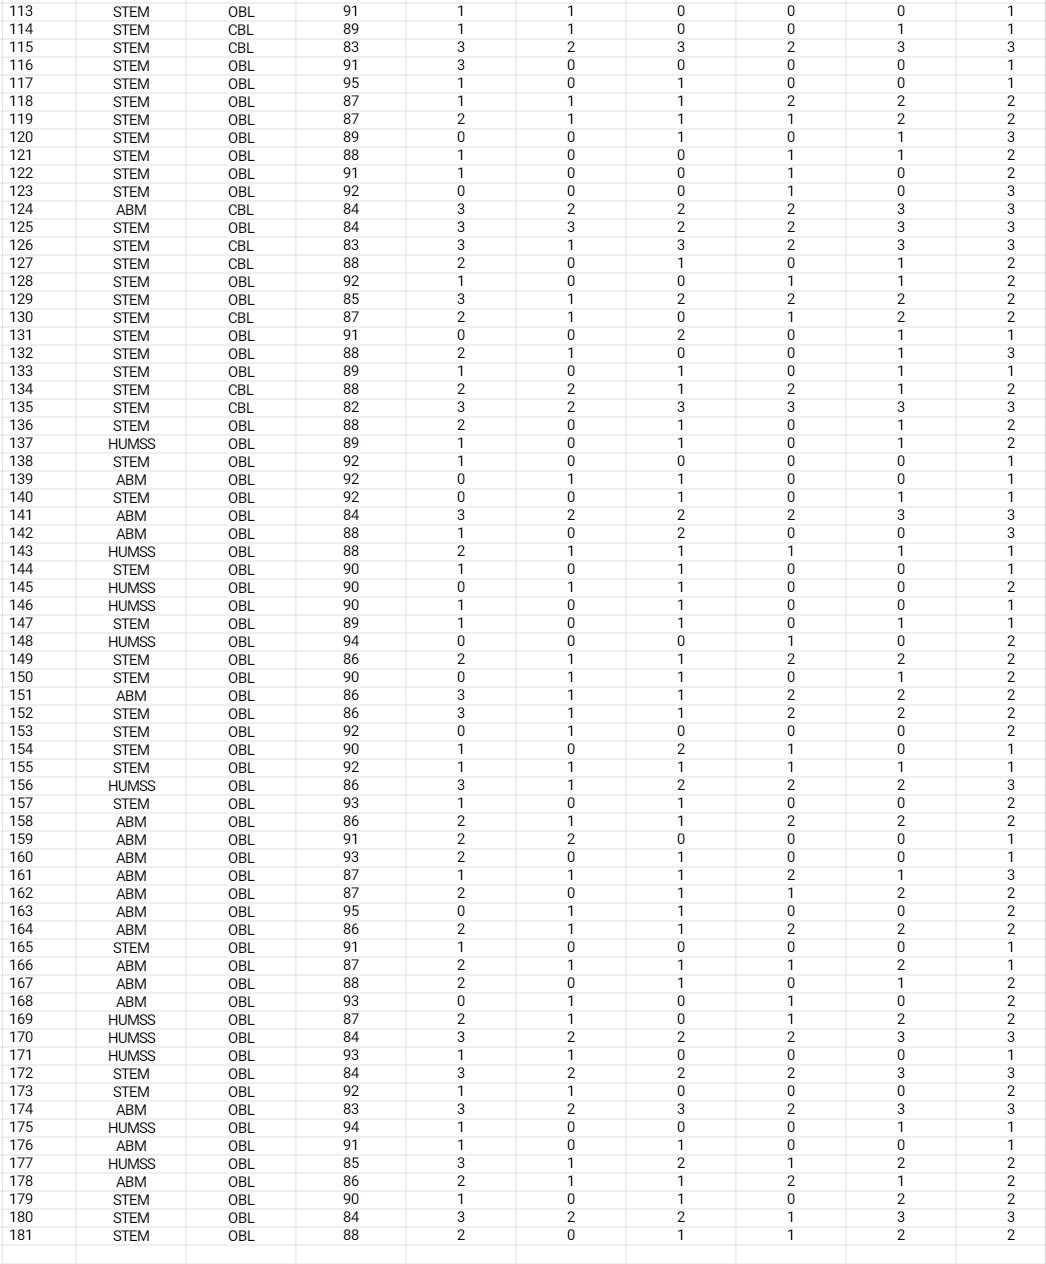
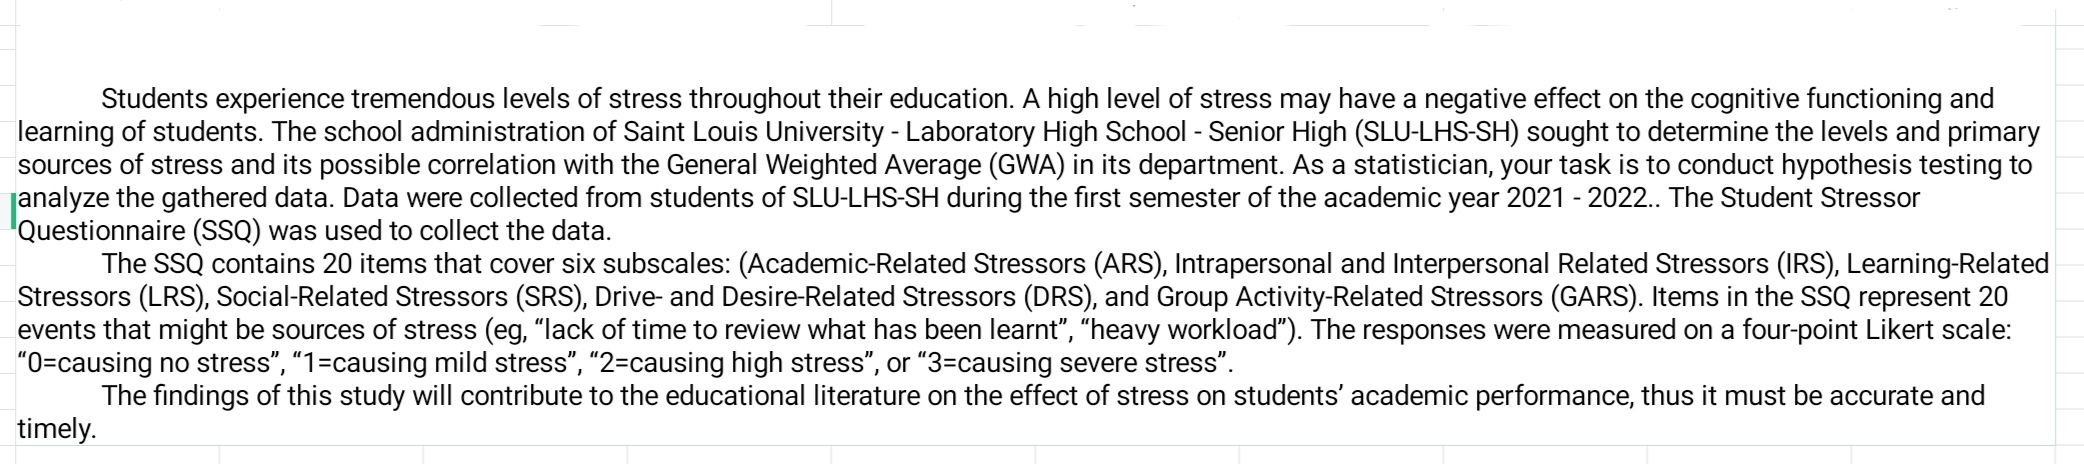
Students experience tremendous levels of stress throughout their education. A high level of stress may have a negative effect on the cognitive functioning and learning of students. The school administration of Saint Louis University - Laboratory High School - Senior High (SLU-LHS-SH) sought to determine the levels and primary sources of stress and its possible correlation with the General Weighted Average (GWA) in its department. As a statistician, your task is to conduct hypothesis testing to analyze the gathered data. Data were collected from students of SLU-LHS-SH during the first semester of the academic year 2021 - 2022.. The Student Stressor Questionnaire (SSQ) was used to collect the data. The SSQ contains 20 items that cover six subscales: (Academic-Related Stressors (ARS), Intrapersonal and Interpersonal Related Stressors (IRS), Learning-Related Stressors (LRS), Social-Related Stressors (SRS), Drive- and Desire-Related Stressors (DRS), and Group Activity-Related Stressors (GARS). Items in the SSQ represent 20 events that might be sources of stress (eg, "lack of time to review what has been learnt", "heavy workload"). The responses were measured on a four-point Likert scale: "0=causing no stress", "1=causing mild stress", "2=causing high stress", or "3=causing severe stress". The findings of this study will contribute to the educational literature on the effect of stress on students' academic performance, thus it must be accurate and timely.Based on the data given in Excel, answer what is asked in each item. 1. What is the overall level of stress experienced by the senior high school students? A. 1.1078 B. 1.3333 C. 1.5331 D. 1.9583 2. What is the overall level of stress experienced by CBL students? A. 1.1078 B. 1.3333 C. 1.5331 D. 1.9583 3. What is the overall level of stress experienced by OBL students? A. 1.1078 B. 1.3333 C. 1.5331 D. 1.9583 4. What is the standard deviation of the level of stress of the senior high students? A. 0. 6027 B. 0.7449 C. 0.7494 D. 0.8215 5. What is the median GWA of the CBL students? A. 85 B. 86 C. 87 D. 89 6. What is the mode of the GWA of the OBL students? A. 85 B. 86 C. 87 D. 89 7. What is the standard deviation of the GWA of senior high students? A. 3.39 B. 3.43 C. 3.45 D. 3.68 8. What is the variance of the GWA of STEM students? A. 11.49 B.11.77 C. 11.90 D. 13.54 9. What generalization can we make about the skewness of the GWA of senior high school students? A. The data is normally distributed. B. The data is skewed to the left. C. The data is skewed to the right. D. The data is not normally distributed. 10. Given the histogram of the GWA ofsenior high school students, what can we say about the mean and the median? A. mean = median B. mean median D. mean ~ median For items 11~20, assuming that the GWA of the senior high school students is normally distributed, answer the following questions. 11. What percent of the senior high school students have GWA below 90? A.0.2843 B. 0.4257 C.0.5743 D. 0.7157 12. What percent of senior high school students have a GWA above 87? A. 0.2944 B. 0.3859 C. 0.6141 D. 0.7056 13. What percent of senior high school students have a grade between 87 and 90? A. 0.3298 B. 0.3859 C. 0.6702 D. 0.7157 _14. What grade divides the group such that 30% of the students have a grade above It? A. 85. 01 B. 86.21 C. 88.26 D. 89.81 _15. What grade do we nd the lowest 10% of the grade? A. 80. 26 B. 83.60 C. 90.04 D. 92.44 16. Between what grades contain the middle 50% ofthe data? A. 86-88 B. 86-90 C. 87-88 D. 88-90 17. What percent of ABM students have a grade above 85? A. 0.1922 B. 0.2148 C. 0.7852 D. 0.8079 18. What percent of HUMSS students have a grade below 89? A. 0.2849 B. 0.3517 C. 0.6103 D. 0.6406 19. What percent of STEM students have a grade between 85 and 89? A. 0.1712 B. 0.4160 C. 0.5840 D. 0.5871 20. How many students have a grade between 85 and 89? A34 B. 76 C105 D.110
Step by Step Solution
There are 3 Steps involved in it
Step: 1
Get Instant Access to Expert-Tailored Solutions
See step-by-step solutions with expert insights and AI powered tools for academic success
Step: 2
Step: 3
Ace Your Homework with AI
Get the answers you need in no time with our AI-driven, step-by-step assistance