Question
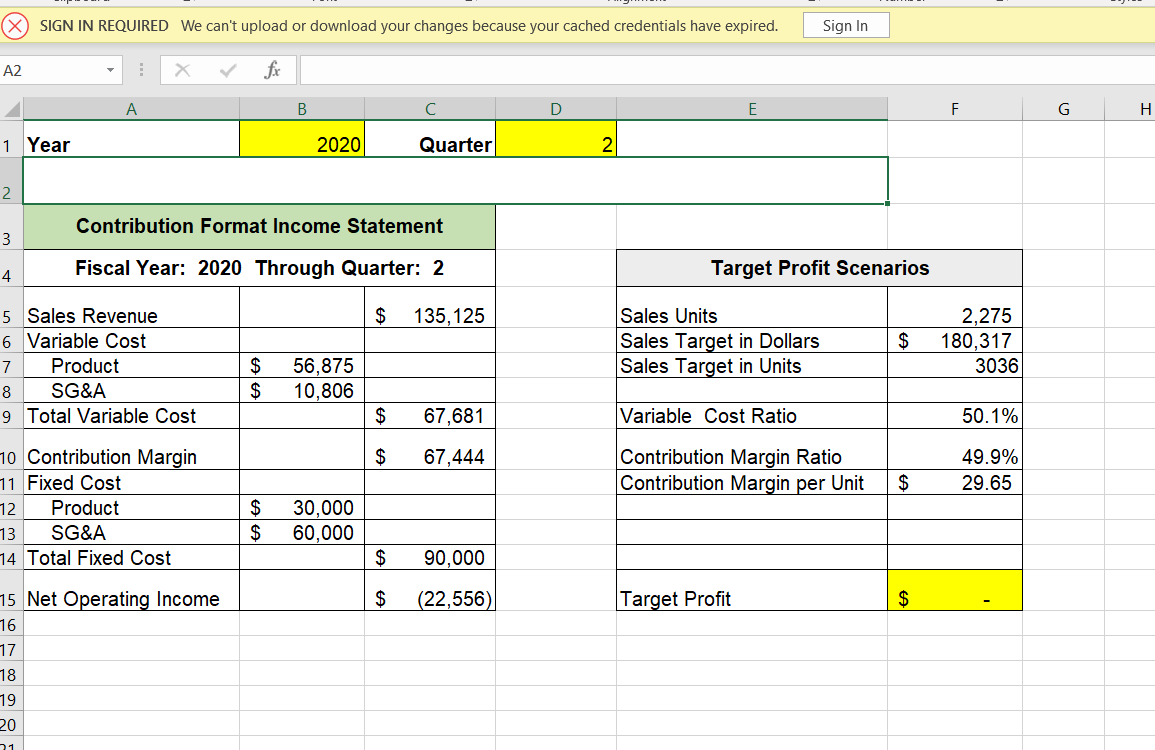
Add a data internal control to the merged cell beginning with cell A2 on the Contribution worksheet. There are two data internal control warnings that

-
Add a data internal control to the merged cell beginning with cell A2 on the Contribution worksheet. There are two data internal control warnings that should be displayed if needed. The first is if the year entered into cell B1 is less than the oldest year or greater than the most recent year on the Sales and Cost Data worksheet. The MIN function can be used to identify the oldest year and the MAX function can be used to identify the most recent year on the Sales and Cost Data worksheet. If the year entered into B1 does not exist in the dataset, the following message should be displayed: Data for this year is not available!. The second data internal control should evaluate if data has been entered beyond Row 125 on the Sales and Cost Data worksheet. If cell A126 on the Sales and Cost Data worksheet is not blank, the following message should be displayed: New Data Exceeds Report Capacity! Use the CONCATENATE function so both data internal control warnings can be displayed if needed. Add space between the two messages in the event they both need to be displayed. HINT: you will need to use IF functions in the CONCATENATE function to display any combination of data internal control warnings that are needed. Add the appropriate entries to test your data internal control
Step by Step Solution
There are 3 Steps involved in it
Step: 1

Get Instant Access to Expert-Tailored Solutions
See step-by-step solutions with expert insights and AI powered tools for academic success
Step: 2

Step: 3

Ace Your Homework with AI
Get the answers you need in no time with our AI-driven, step-by-step assistance
Get Started


