

Question
Add input validation for cells I4 (years 2000 through 2017) and I5 (months 1 through 12). The user will be able to specify/choose the Year
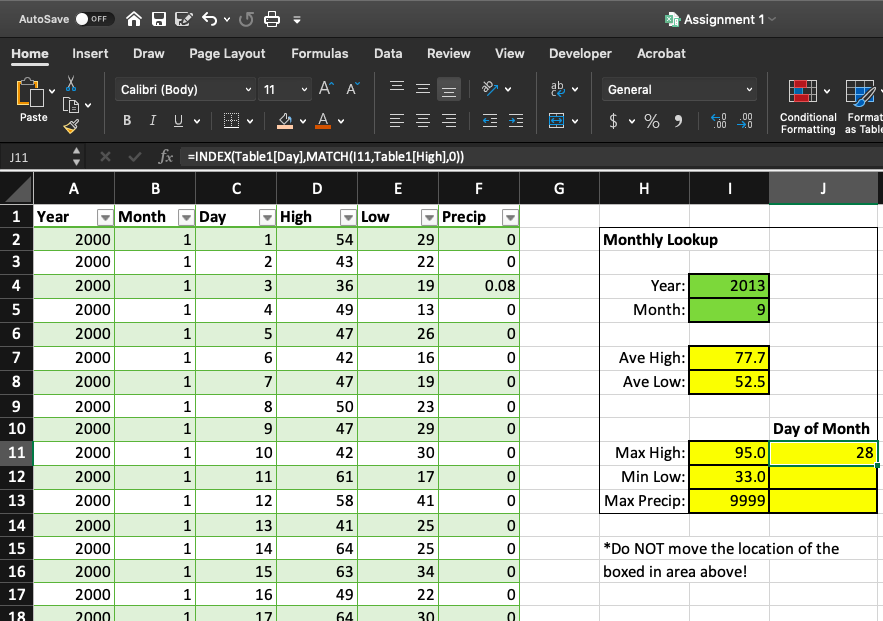
- Add input validation for cells I4 (years 2000 through 2017) and I5 (months 1 through 12). The user will be able to specify/choose the Year and Month. You need to put in formulas in the 8 yellow highlighted cells.
- The Ave High cell (I7) will calculate the average High of all cells with the Year specified in cell I4 and Month specified in cell I5; the Ave Low cell (I8) will calculate the average Low of all cells with the Year specified in cell I4 and Month specified in cell I5.
- The Max High, Min Low, and Max Precip cells (I11 through I13) will calculate the maximum High temperature, minimum Low temperature, and maximum Precip values of all cells with the Year specified in cell I4 and Month specified in cell I5.
- Finally, cells J11:J13 will calculate the corresponding days of the month that the Max High, Min Low, and Max Precip values were attained. Note that if there are multiple matches for these values, the typical formulas/functions that we've been considering will only find the 1st match and not all of them.
Only need answer for cells J11:J13, previous things are completed and correct. I need to find corresponding day of the month for which "max high" has been attained. The values go down up to 4000. Formula I have in cell J11 gives me wrong answer.
AutoSave OFF DES 5- Assignment 1 Acrobat Home Insert Draw Page Layout Formulas Data Review View Developer X Calibri (Body) 11 ~ I General Paste BIU V A V $ % ) 70 Conditional Format Formatting as Tabl F G H I j Monthly Lookup WN 0 0 NP 3 Year: Month: 2013 9 5 0 77.7 J11 x fx =INDEX(Table1[Day),MATCH(111,Table1[High),0)) B D E F 1 Year Month Day High Low Precip 2 2000 1 54 29 0 3 2000 1 2 43 22 0 4 2000 1 3 36 19 0.08 5 2000 1 4 49 13 0 6 2000 1 5 47 26 0 7 2000 1 6 42 16 8 2000 1 7 47 19 0 9 2000 1 8 23 0 10 2000 1 9 47 29 0 2000 1 10 42 30 0 2000 1 61 17 0 2000 1 12 58 0 14 2000 1 13 41 25 0 2000 1 14 64 25 0 2000 1 15 63 34 0 17 2000 1 16 49 22 0 2000 64 30 Ave High: Ave Low: 52.5 50 11 Day of Month 95.0 28 33.0 9999 11 Max High: Min Low: Max Precip: 12 13 41 15 *Do NOT move the location of the boxed in area above! 16 18 17 AutoSave OFF DES 5- Assignment 1 Acrobat Home Insert Draw Page Layout Formulas Data Review View Developer X Calibri (Body) 11 ~ I General Paste BIU V A V $ % ) 70 Conditional Format Formatting as Tabl F G H I j Monthly Lookup WN 0 0 NP 3 Year: Month: 2013 9 5 0 77.7 J11 x fx =INDEX(Table1[Day),MATCH(111,Table1[High),0)) B D E F 1 Year Month Day High Low Precip 2 2000 1 54 29 0 3 2000 1 2 43 22 0 4 2000 1 3 36 19 0.08 5 2000 1 4 49 13 0 6 2000 1 5 47 26 0 7 2000 1 6 42 16 8 2000 1 7 47 19 0 9 2000 1 8 23 0 10 2000 1 9 47 29 0 2000 1 10 42 30 0 2000 1 61 17 0 2000 1 12 58 0 14 2000 1 13 41 25 0 2000 1 14 64 25 0 2000 1 15 63 34 0 17 2000 1 16 49 22 0 2000 64 30 Ave High: Ave Low: 52.5 50 11 Day of Month 95.0 28 33.0 9999 11 Max High: Min Low: Max Precip: 12 13 41 15 *Do NOT move the location of the boxed in area above! 16 18 17Step by Step Solution
There are 3 Steps involved in it
Step: 1

Get Instant Access to Expert-Tailored Solutions
See step-by-step solutions with expert insights and AI powered tools for academic success
Step: 2

Step: 3
Ace Your Homework with AI
Get the answers you need in no time with our AI-driven, step-by-step assistance
Get Started
Auditing The Art and Science of Assurance Engagements
Authors: Alvin A. Arens, Randal J. Elder, Mark S. Beasley, Joanne C. Jones
13th Canadian edition
133405508, 978-0133405507