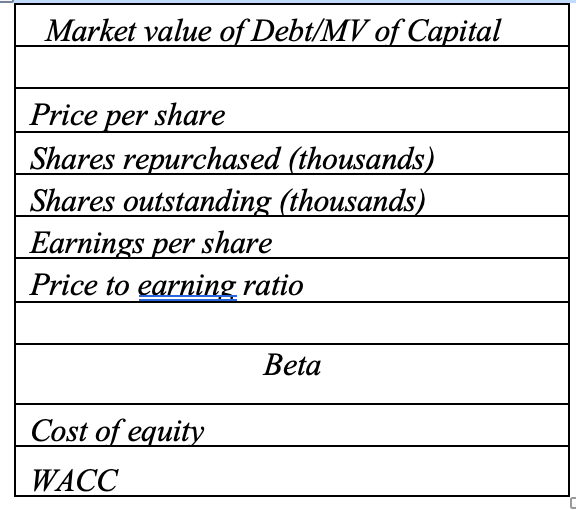
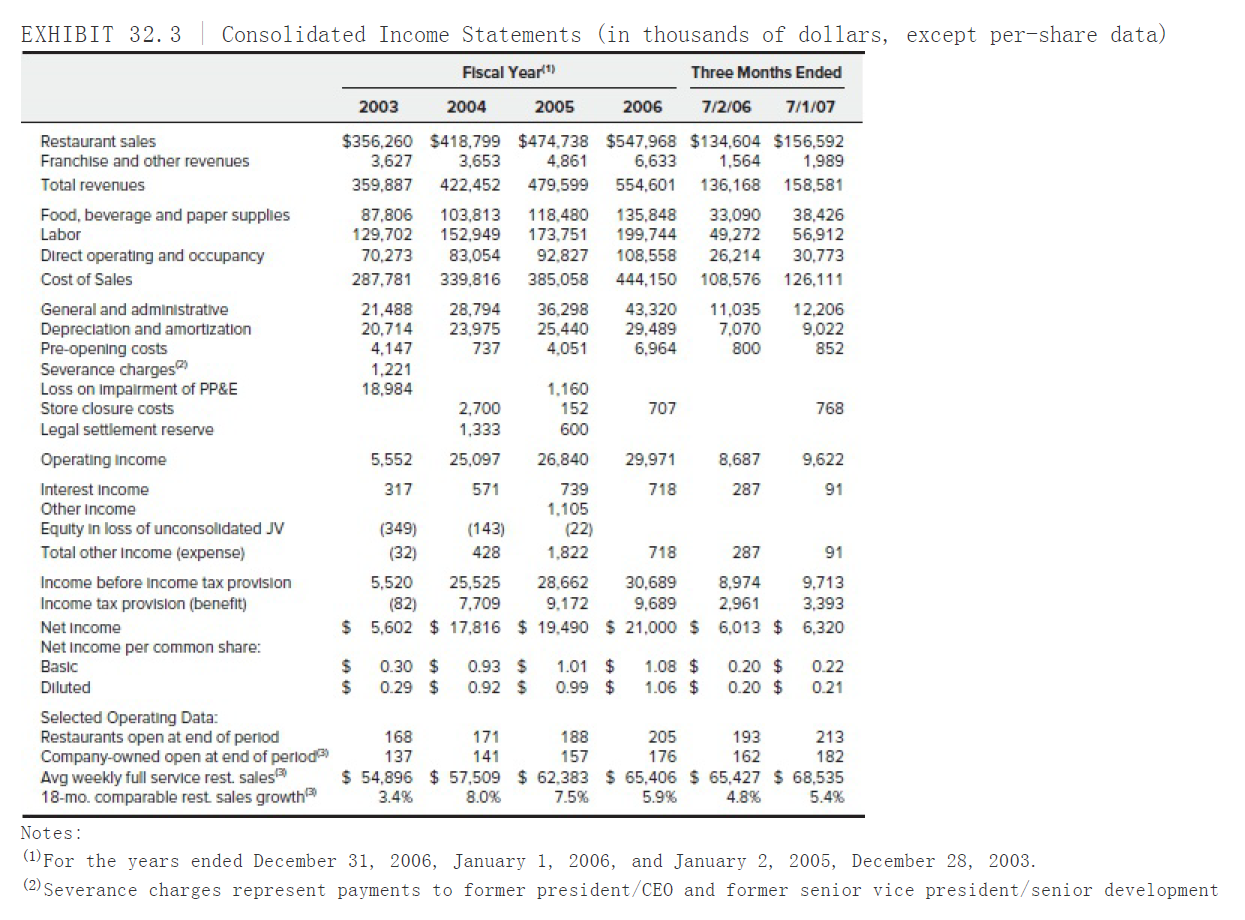
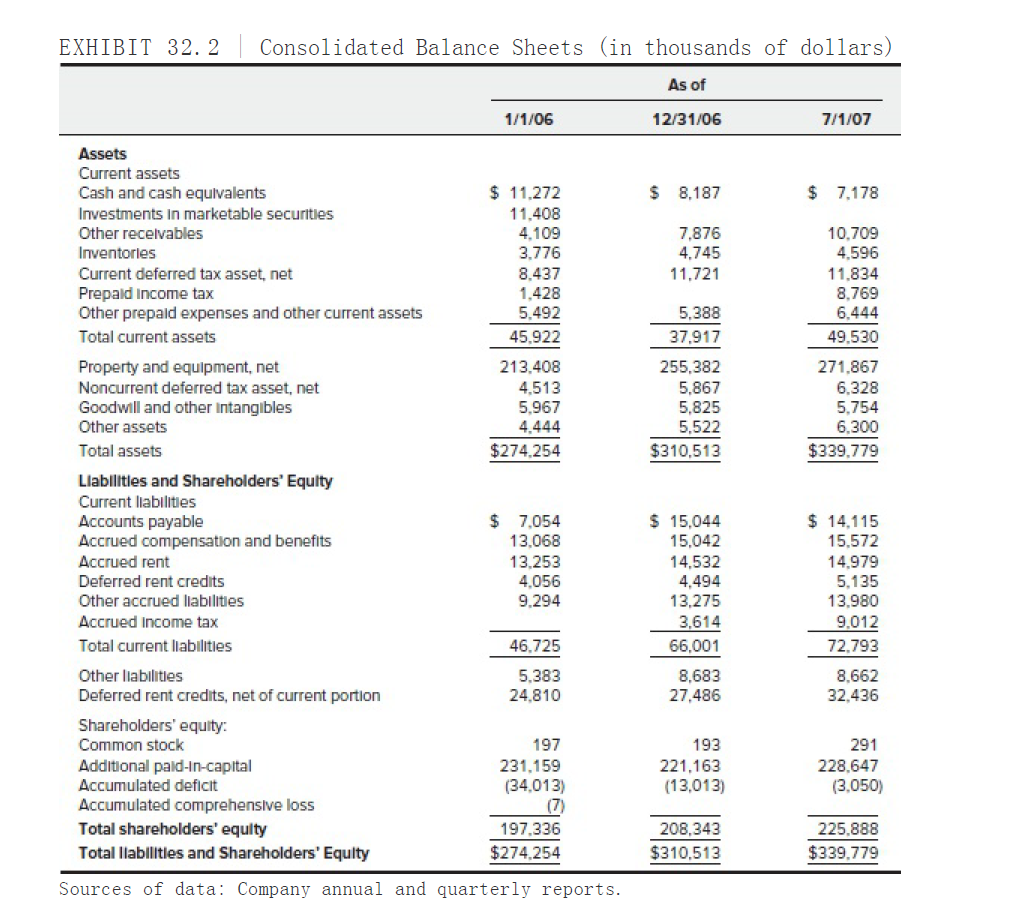
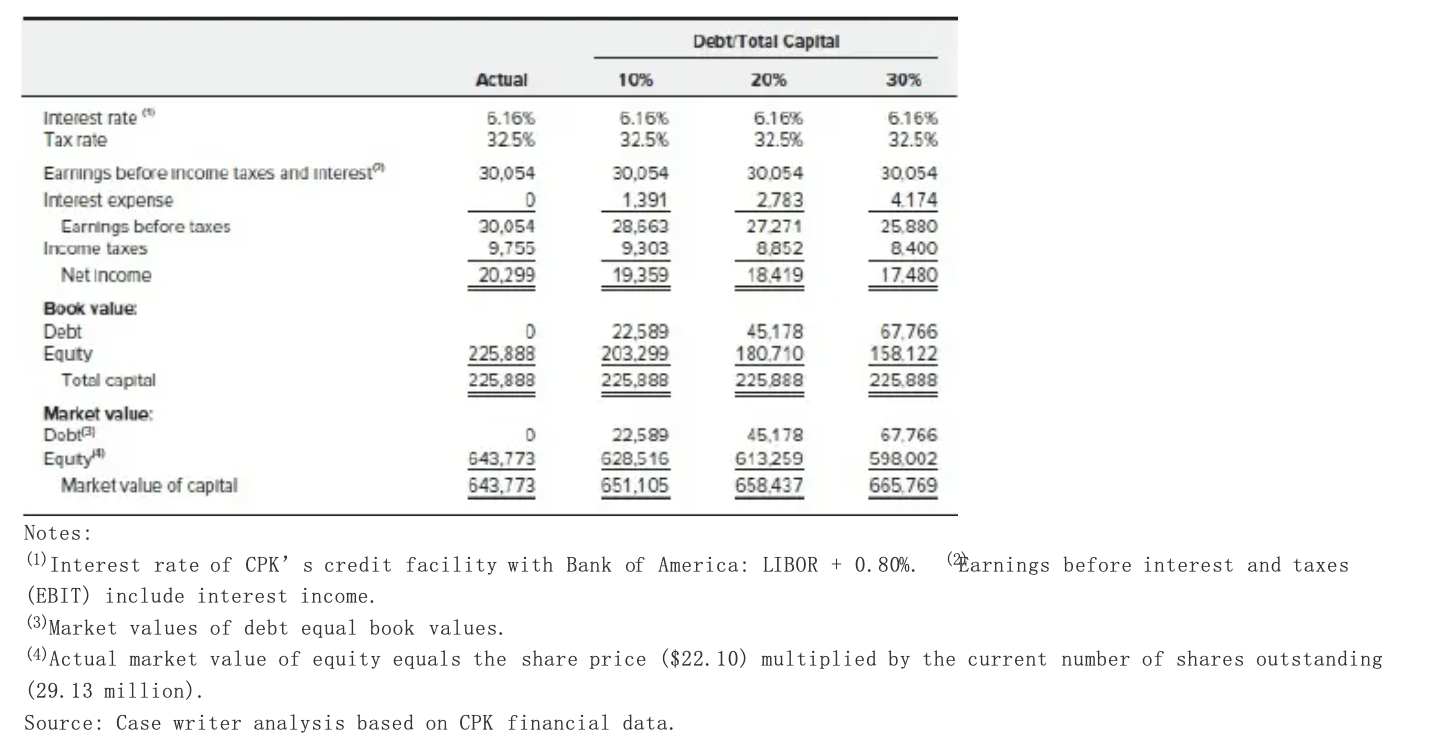
Add the following values to the table provided below using data from Exhibit 9 and complete it for the actual scenario and the three proposed scenarios: (Do in spread sheet thank you)


Market value of Debt/MV of Capital Price per share Shares repurchased (thousands) Shares outstanding (thousands) Earnings per share Price to earning ratio Beta Cost of equity WACC In April 2007, Brinker announced it had secured a new $400 million unsecured, committed credit-facility to fund an accelerated share repurchase transaction in which approximately $300 million of its common stock would be repurchased. That followed a tender offer recapitalization 2006 in which the company repurchased $50 million worth of common shares. EXHIBIT 32. 3 Consolidated Income Statements (in thousands of dollars, except per-share data) Fiscal Year) Three Months Ended 2003 2004 2005 2006 7/2/06 7/1/07 Restaurant sales Franchise and other revenues Total revenues Food, beverage and paper supplies Labor Direct operating and occupancy Cost of Sales General and administrative Depreciation and amortization Pre-opening costs Severance charges Loss on Impairment of PP&E Store closure costs Legal settlement reserve Operating Income Interest Income Other Income Equity in loss of unconsolidated JV Total other Income (expense) Income before Income tax provision Income tax provision (benefit) Net Income Net Income per common share: Basic Diluted $356,260 $418,799 $474,738 $547,968 $134,604 $156,592 3.627 3,653 4,861 6.633 1.564 1.989 359.887 422,452 479.599 554,601 136,168 158.581 87.806 103.813 118.480 135,848 33.090 38,426 129,702 152.949 173.751 199.744 49,272 56,912 70,273 83,054 92.827 108,558 26,214 30,773 287,781 339.816 385.058 444.150 108,576 126.111 21,488 28,794 36,298 43.320 11,035 12.206 20.714 23.975 25.440 29,489 7,070 9,022 4,147 737 4.051 6,964 800 852 1,221 18.984 1.160 2.700 152 707 768 1,333 600 9,622 91 5,552 25.097 26.840 29.971 8.687 317 571 739 718 287 1.105 (349) (143) (22) (32) 428 1.822 718 287 5,520 25,525 28.662 30,689 8.974 (82) 7,709 9.172 9,689 2.961 5.602 $ 17.816 $ 19.490 $ 21.000 $ 6,013 $ 91 9.713 3,393 6,320 $ $ $ 0.30 $ 0.29 $ 0.93 $ 0.92 $ 1.01 $ 0.99 $ 1.08 $ 1.06 $ 0.20 $ 0.20 $ 0.22 0.21 Selected Operating Data: Restaurants open at end of period Company-owned open at end of period Avg weekly full service rest. sales 18-mo. comparable rest sales growth 168 171 188 205 193 213 137 141 176 162 182 $ 54,896 $ 57,509 $ 62.383 $ 65,406 $ 65,427 $ 68,535 3.4% 8.0% 7.5% 5.9% 4.8% 5.4% 157 Notes: (1) For the years ended December 31, 2006, January 1, 2006, and January 2, 2005, December 28, 2003. (2) Severance charges represent payments to former president/CEO and former senior vice president/senior development EXHIBIT 32. 2 Consolidated Balance Sheets (in thousands of dollars) As of 1/1/06 12/31/06 7/1/07 $ 8.187 7.178 $ 11.272 11,408 4,109 3.776 8.437 1,428 5.492 45.922 7,876 4.745 11.721 10.709 4.596 11.834 8.769 6.444 49.530 5.388 37.917 Assets Current assets Cash and cash equivalents Investments in marketable securities Other receivables Inventories Current deferred tax asset.net Prepaid income tax Other prepaid expenses and other current assets Total current assets Property and equipment, net Noncurrent deferred tax asset, net Goodwill and other intangibles Other assets Total assets Llabilities and Shareholders' Equity Current liabilities Accounts payable Accrued compensation and benefits Accrued rent Deferred rent credits Other accrued liabilities Accrued Income tax Total current liabilities 213.408 4.513 5.967 4.444 $274,254 255.382 5.867 5,825 5,522 $310,513 271.867 6.328 5,754 6.300 $339.779 $ 7,054 13.068 13.253 4.056 9.294 $ 15,044 15.042 14,532 4,494 13,275 3,614 66.001 $ 14.115 15.572 14.979 5,135 13.980 9.012 72.793 8.662 32.436 46,725 5.383 24.810 8,683 27.486 Other liabilities Deferred rent credits, net of current portion Shareholders' equity Common stock Additional paid-In-capital Accumulated deficit Accumulated comprehensive loss Total shareholders' equity Total liabilities and Shareholders' Equity 193 221.163 (13,013) 291 228.647 (3.050) 197 231.159 (34.013) (7) 197.336 $274.254 208.343 $310.513 225.888 $339.779 Sources of data: Company annual and quarterly reports. EXHIBIT 32. 7 Comparative Restaurant Financial Data, 2006 Fiscal Year (in millions of dollars, except per-share data) Fiscal Year End Month 7/2/2007 Share Price Earnings EBITDA Margin Net Profit Margin Dividends per Share Book Value per Share Revenue per Share Beta California Pizza Kitchen Dec. $22.10 $55 10.7% 3.8% $0.71 $ 0.00 $7.20 0.85 Return on Current Assets Current Liabilities Total Debt Share Equity Debt/ Capital Interest Coverage Total Capital Turnover Capital Equity California Pizza Kitchen $ 38 $ 66 $ 0 $ 208 0.0% NME 2.7 10.1% 10.1% Debt Total Capital Actual 10% 20% 30% 6.16% 32.5% 5.16% 32.5% 6.16% 32.5% 6.16% 32.5% 30.054 0 30.054 9,755 20.299 30,054 1.391 28.663 9,303 19.359 30.054 2.783 27271 8,852 18.419 30.054 4.174 25.880 8.400 17.480 Interest rate Tax rate Earnings before income taxes and interest Interest expense Earnings before taxes Income taxes Net Income Book value: Debt Equty Total capital Market value: Dobt31 Equity" Market value of capital 0 225,888 225,888 22.589 203,299 225,888 45,178 180.710 225888 67.766 158122 225.888 D 643,773 643,773 22,589 628,516 651,105 45,178 613259 658,437 67.766 598.002 665.769 Notes: (1) Interest rate of CPK's credit facility with Bank of America: LIBOR + 0. 80%. (Parnings before interest and taxes (EBIT) include interest income. (3) Market values of debt equal book values. (1) Actual market value of equity equals the share price ($22. 10) multiplied by the current number of shares outstanding (29. 13 million). Source: Case writer analysis based on CPK financial data. Market value of Debt/MV of Capital Price per share Shares repurchased (thousands) Shares outstanding (thousands) Earnings per share Price to earning ratio Beta Cost of equity WACC In April 2007, Brinker announced it had secured a new $400 million unsecured, committed credit-facility to fund an accelerated share repurchase transaction in which approximately $300 million of its common stock would be repurchased. That followed a tender offer recapitalization 2006 in which the company repurchased $50 million worth of common shares. EXHIBIT 32. 3 Consolidated Income Statements (in thousands of dollars, except per-share data) Fiscal Year) Three Months Ended 2003 2004 2005 2006 7/2/06 7/1/07 Restaurant sales Franchise and other revenues Total revenues Food, beverage and paper supplies Labor Direct operating and occupancy Cost of Sales General and administrative Depreciation and amortization Pre-opening costs Severance charges Loss on Impairment of PP&E Store closure costs Legal settlement reserve Operating Income Interest Income Other Income Equity in loss of unconsolidated JV Total other Income (expense) Income before Income tax provision Income tax provision (benefit) Net Income Net Income per common share: Basic Diluted $356,260 $418,799 $474,738 $547,968 $134,604 $156,592 3.627 3,653 4,861 6.633 1.564 1.989 359.887 422,452 479.599 554,601 136,168 158.581 87.806 103.813 118.480 135,848 33.090 38,426 129,702 152.949 173.751 199.744 49,272 56,912 70,273 83,054 92.827 108,558 26,214 30,773 287,781 339.816 385.058 444.150 108,576 126.111 21,488 28,794 36,298 43.320 11,035 12.206 20.714 23.975 25.440 29,489 7,070 9,022 4,147 737 4.051 6,964 800 852 1,221 18.984 1.160 2.700 152 707 768 1,333 600 9,622 91 5,552 25.097 26.840 29.971 8.687 317 571 739 718 287 1.105 (349) (143) (22) (32) 428 1.822 718 287 5,520 25,525 28.662 30,689 8.974 (82) 7,709 9.172 9,689 2.961 5.602 $ 17.816 $ 19.490 $ 21.000 $ 6,013 $ 91 9.713 3,393 6,320 $ $ $ 0.30 $ 0.29 $ 0.93 $ 0.92 $ 1.01 $ 0.99 $ 1.08 $ 1.06 $ 0.20 $ 0.20 $ 0.22 0.21 Selected Operating Data: Restaurants open at end of period Company-owned open at end of period Avg weekly full service rest. sales 18-mo. comparable rest sales growth 168 171 188 205 193 213 137 141 176 162 182 $ 54,896 $ 57,509 $ 62.383 $ 65,406 $ 65,427 $ 68,535 3.4% 8.0% 7.5% 5.9% 4.8% 5.4% 157 Notes: (1) For the years ended December 31, 2006, January 1, 2006, and January 2, 2005, December 28, 2003. (2) Severance charges represent payments to former president/CEO and former senior vice president/senior development EXHIBIT 32. 2 Consolidated Balance Sheets (in thousands of dollars) As of 1/1/06 12/31/06 7/1/07 $ 8.187 7.178 $ 11.272 11,408 4,109 3.776 8.437 1,428 5.492 45.922 7,876 4.745 11.721 10.709 4.596 11.834 8.769 6.444 49.530 5.388 37.917 Assets Current assets Cash and cash equivalents Investments in marketable securities Other receivables Inventories Current deferred tax asset.net Prepaid income tax Other prepaid expenses and other current assets Total current assets Property and equipment, net Noncurrent deferred tax asset, net Goodwill and other intangibles Other assets Total assets Llabilities and Shareholders' Equity Current liabilities Accounts payable Accrued compensation and benefits Accrued rent Deferred rent credits Other accrued liabilities Accrued Income tax Total current liabilities 213.408 4.513 5.967 4.444 $274,254 255.382 5.867 5,825 5,522 $310,513 271.867 6.328 5,754 6.300 $339.779 $ 7,054 13.068 13.253 4.056 9.294 $ 15,044 15.042 14,532 4,494 13,275 3,614 66.001 $ 14.115 15.572 14.979 5,135 13.980 9.012 72.793 8.662 32.436 46,725 5.383 24.810 8,683 27.486 Other liabilities Deferred rent credits, net of current portion Shareholders' equity Common stock Additional paid-In-capital Accumulated deficit Accumulated comprehensive loss Total shareholders' equity Total liabilities and Shareholders' Equity 193 221.163 (13,013) 291 228.647 (3.050) 197 231.159 (34.013) (7) 197.336 $274.254 208.343 $310.513 225.888 $339.779 Sources of data: Company annual and quarterly reports. EXHIBIT 32. 7 Comparative Restaurant Financial Data, 2006 Fiscal Year (in millions of dollars, except per-share data) Fiscal Year End Month 7/2/2007 Share Price Earnings EBITDA Margin Net Profit Margin Dividends per Share Book Value per Share Revenue per Share Beta California Pizza Kitchen Dec. $22.10 $55 10.7% 3.8% $0.71 $ 0.00 $7.20 0.85 Return on Current Assets Current Liabilities Total Debt Share Equity Debt/ Capital Interest Coverage Total Capital Turnover Capital Equity California Pizza Kitchen $ 38 $ 66 $ 0 $ 208 0.0% NME 2.7 10.1% 10.1% Debt Total Capital Actual 10% 20% 30% 6.16% 32.5% 5.16% 32.5% 6.16% 32.5% 6.16% 32.5% 30.054 0 30.054 9,755 20.299 30,054 1.391 28.663 9,303 19.359 30.054 2.783 27271 8,852 18.419 30.054 4.174 25.880 8.400 17.480 Interest rate Tax rate Earnings before income taxes and interest Interest expense Earnings before taxes Income taxes Net Income Book value: Debt Equty Total capital Market value: Dobt31 Equity" Market value of capital 0 225,888 225,888 22.589 203,299 225,888 45,178 180.710 225888 67.766 158122 225.888 D 643,773 643,773 22,589 628,516 651,105 45,178 613259 658,437 67.766 598.002 665.769 Notes: (1) Interest rate of CPK's credit facility with Bank of America: LIBOR + 0. 80%. (Parnings before interest and taxes (EBIT) include interest income. (3) Market values of debt equal book values. (1) Actual market value of equity equals the share price ($22. 10) multiplied by the current number of shares outstanding (29. 13 million). Source: Case writer analysis based on CPK financial data


