

Answered step by step
Verified Expert Solution
Question
1 Approved Answer
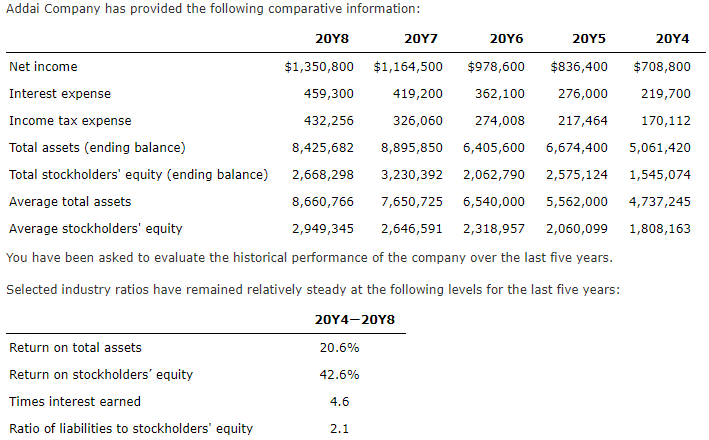
Addai Company has provided the following comparative information: 2018 2017 2046 2015 2044 $708,800 219,700 170,112 5,061,420 1,545,074 Net income $1,350,800 $1,164,500 $978,600 $836,400 Interest
Step by Step Solution
There are 3 Steps involved in it
Step: 1

Get Instant Access to Expert-Tailored Solutions
See step-by-step solutions with expert insights and AI powered tools for academic success
Step: 2

Step: 3
Ace Your Homework with AI
Get the answers you need in no time with our AI-driven, step-by-step assistance
Get Started
Multicriteria Decision Making Systems Modeling Risk Assessment And Financial Analysis For Technical Projects
Authors: Timothy Havranek, Doug MacNair, James Wolf
3110765640, 978-3110765649