Answered step by step
Verified Expert Solution
Question
1 Approved Answer
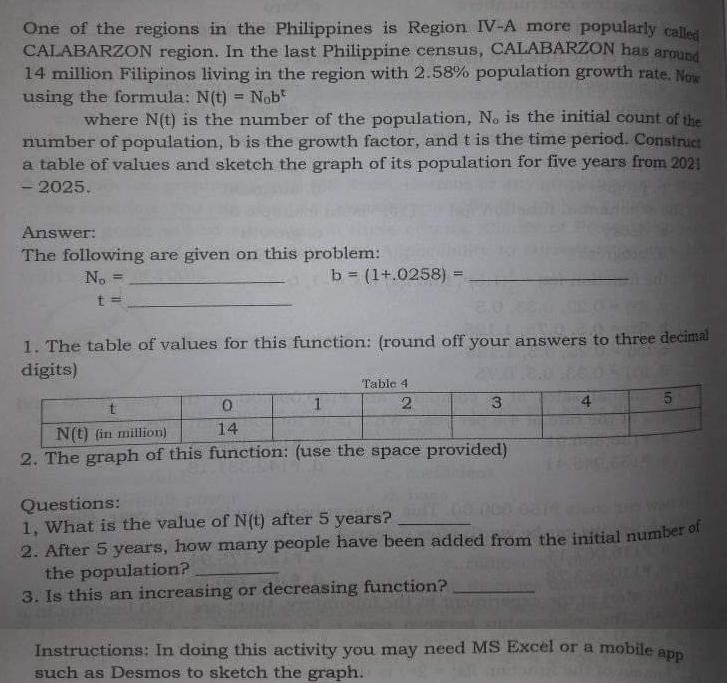
One of the regions in the Philippines is Region IV-A more popularly called CALABARZON region. In the last Philippine census, CALABARZON has around 14

One of the regions in the Philippines is Region IV-A more popularly called CALABARZON region. In the last Philippine census, CALABARZON has around 14 million Filipinos living in the region with 2.58% population growth rate. Noi using the formula: N(t) = Nob %3! where N(t) is the number of the population, No is the initial count of the number of population, b is the growth factor, and t is the time period. Construct a table of values and sketch the graph of its population for five years from 2021 - 2025. Answer: The following are given on this problem: No b = (1+.0258) = %3D 1. The table of values for this function: (round off your answers to three decimal digits) Table 4 4 14 N(t) fin million) 2. The graph of this function: (use the space provided). Questions: 1, What is the value of N(t) after 5 years? 2. After 5 years, how many people have been added from the initial number of the population? 3. Is this an increasing or decreasing function? Instructions: In doing this activity you may need MS Excel or a mobile ans such as Desmos to sketch the graph.
Step by Step Solution
★★★★★
3.46 Rating (159 Votes )
There are 3 Steps involved in it
Step: 1
Le 44109 mi...
Get Instant Access to Expert-Tailored Solutions
See step-by-step solutions with expert insights and AI powered tools for academic success
Step: 2

Step: 3

Ace Your Homework with AI
Get the answers you need in no time with our AI-driven, step-by-step assistance
Get Started


