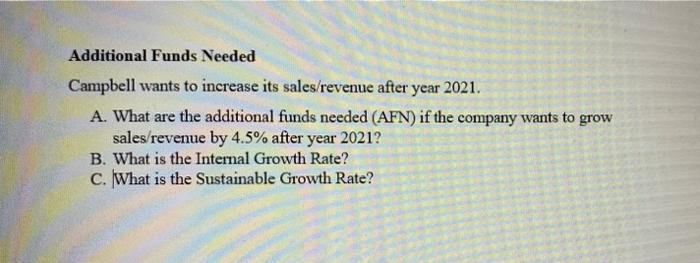
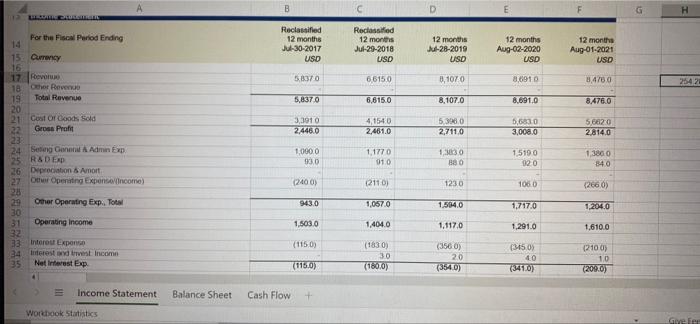
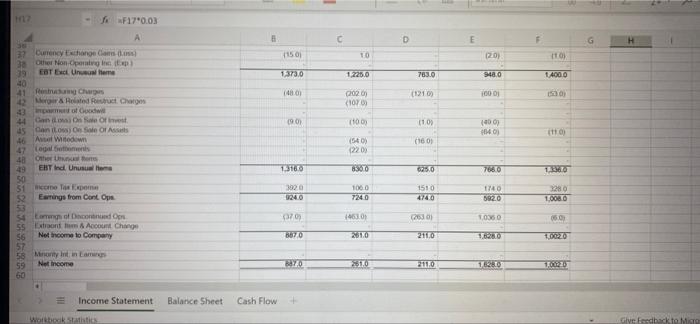
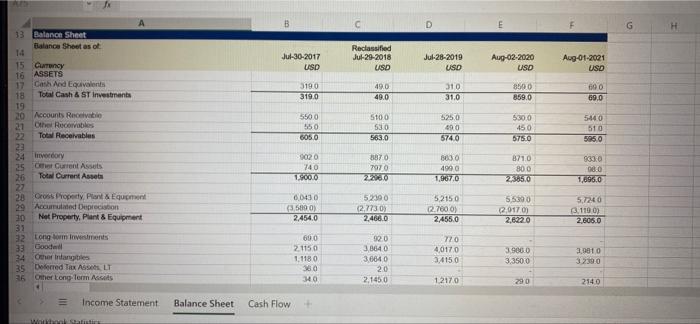
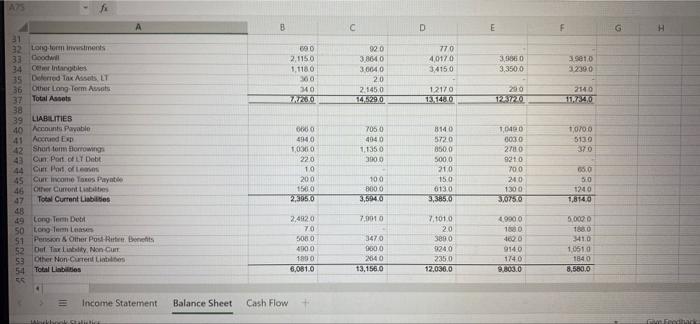
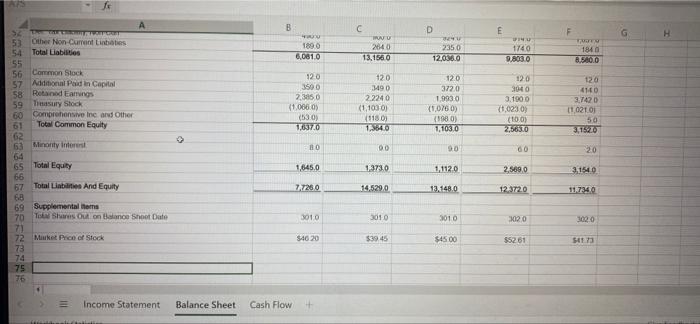
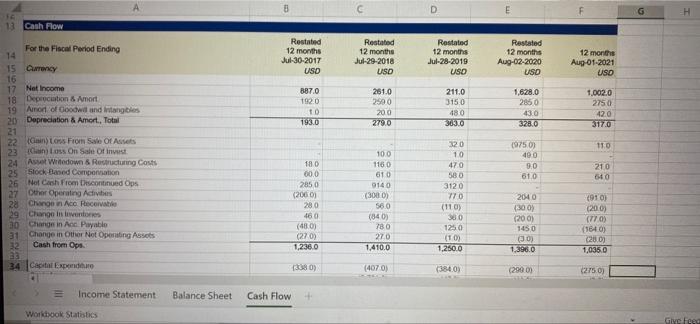
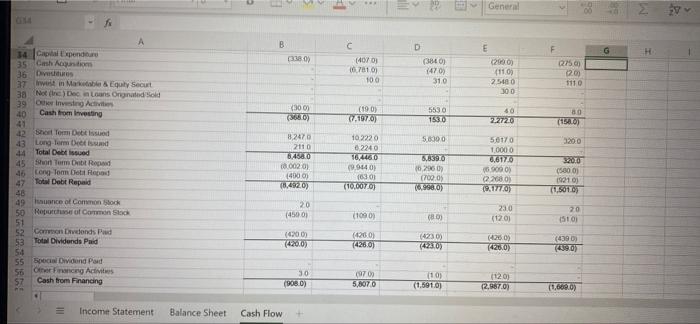
Additional Funds Needed Campbell wants to increase its sales/revenue after year 2021. A. What are the additional funds needed (AFN) if the company wants to grow sales/revenue by 4.5% after year 2021? B. What is the Internal Growth Rate? c. What is the Sustainable Growth Rate? B D G 2 LOCALELLIS For the Fiscal Period Ending Reclassified 12 months J-30-2017 USD Reclassified 12 months Jul-29-2018 USD 12 months J-28-2019 USD 12 months Aug-02-2020 USD 12 months Aug-01-2021 USD 5B30 66150 0,1070 86910 8,478,0 2542 5,8370 6,615.0 8.107.0 8.691.0 8.476.0 3,3910 2446.0 4,1540 2.461.0 5.398,0 2,7110 5,6830 3,008,0 5,6620 28140 15 Curry 16 17 Revo 18 Other Revenge 19 Total Revenue 20 21 Cost Of Cod Sold 22 Gross Profit 23 24 Seng Con A Admin Exp 25 R&DERD 26 Depreciation 6 Amort 27 Other Operating Expendincome) 28 29 Omer Operating Exp. Tot 30 31 Operating Income 32 33 Intorout Expono 34 rest trest Income 35 Net Interest Exp 1.000.0 93.0 1,1770 010 1,30 880 1.5190 920 1,3860 84.0 (2400) (2110) 1230 1060 (2660) 94370 1,0570 1.504.0 1.717.0 12040 1.503.0 1,4040 1.117,0 1,291.0 1.610.0 (1150) (1830) 30 (18070) (3560) 20 (3540) (3450) 40 (3410) (2100) 10 (209.0) (116.0) LII Income Statement Balance Sheet Cash Flow + Wonok Statistics Gefes C D E G H 15.01 TO (20) 1.373.0 1225.0 783.0 948.0 14000 (480 (1210) 100 DI 2020 (1070) 0902 co 1103 (90) 1640) 11 HE F170.03 A 32 Currency changes 38 Other Non-Operation 39 EDT Exc. Unsere 40 41 Penghar 42 Mera Holted Perut. Charge 43 of 44 Canos e 15 Canton Or Assis 46 Antal Window togalaam 48 Other EBT Ind Unusuwa 50 51 come To Expo 52 Earnings from Cant op 53 54 Loof Descador 55 Extron Account Change $6 Net income to Company 57 58 Montent in Las 59 Net Income 60 (540) 12200 (160) 1531650 BOO 6250 7660 1360 1000 3320 9240 1510 47400 1740 3820 1280 10080 (370) 4601 2030 10360 060 6670 2010 2110 1680 10020 Bayo 2510 2110 1626 T220 Income Statement Balance Sheet Cash Flow Worshock Statistics Give Esedback to MITO D G Jul-30-2017 USD Reclassified Jul-29-2018 USD Jul-28-2019 USO Aug-02-2020 USD Aug-01-2021 USD 3190 319,0 49.0 49.0 310 31.0 8500 859.0 600 69.0 5500 550 6050 5100 530 563.0 5250 690 5740 530,0 450 5750 5440 510 5950 33 Balance Sheet Balance sheet as ot 14 15 Currency 16 ASSETS 17 On Ad Equivalents 18 Total Cash & ST Investments 19 20 Accounts Receivati 21 Other Recorable Total Receivables 22 24 ory 25 Ost Current Assets 26 Total Current Asset 22 28 Cross Property Plant & Equipment 20 Accumulated Depreciation 20 Net Property. Plant & Equipment 31 32 Longform investments 33 Good 34 Other Infantiles 35 Deferred Tax Asses LT 25 Other Long Term Assis 3870 9020 740 TSKO 7970 3030 4900 1.6670 871.0 800 23365.0 9330 900 1,696,0 22 6.000 (3.5890) 2.454.0 52100 (2.7730) 24600 52150 12.700 2.455.0 5.5390 20170) 2,6220 5,7240 3.110 01 2.605.0 600 2 1150 11180 360 340 900 3.8640 3.6640 20 2,1450 720 40170 34150 3.906.0 3.350.0 3,9010 32390 12170 290 2140 Income Statement Balance Sheet Cash Flow Walati 8 D E F G 770 40170 34150 3,9860 3,350.0 35010 12300 090 2,1150 1.1180 VO 340 TR20 920 38640 30040 20 2.145.0 14,1290 1 2170 EXO 280 TFPZO 2140 ITTO A 21 32 Longlor investments 33 Goodwill 34 Cew Intangibles 35 Dolored Tak A.LT 36 Other Long Term Assas 37 Total Assets 38 39 LIABILITIES 40 Accounts Payable 41 Accrued Exp 42 Short to borrowing 43 Cr Port of LT Debt 44 C Portofte 45 Cur income Tax Payne 46 Other Curront bites 47 Total Current Liabilities 48 49 Cong Term Dett 50 Long Term Les 51 Person Other Posters 52 Our tably, Mon Cute 53 Other Non-currencias 54 Total Lines 55 7050 4040 1.1350 3000 1000 5130 370 0600 4940 1,0300 220 10 200 1500 2,305.0 3140 5720 8500 5000 210 150 6130 3,3850 1,000 0030 2100 9210 700 240 1300 376750 100 3000 36940 650 50 1240 1,8740 7.0010 24120 70 5000 4000 1800 6.0810 7,1010 20 3890 9240 2350 12.036.0 49900 1600 4000 6140 3470 3600 2640 13,156,0 50000 1680 410 10510 1840 8.580.0 1140 978030 Income Statement Balance Sheet Cash Flow ALL f B H 1896 6.081.0 MONU 2640 13.1560 D NU 2350 12.033.0 10 1740 0.803.0 1840 8.580.0 120 3500 2,3850 (1.066.09 (530) 176370 120 3490 2.2240 (1,1030) (1180) 1.3640 120 3720 1.9930 (1.0760) (1980) 1.10370 120 3040 3.1000 4.02309 (100) 2.56370 120 410 3.7420 11 0210 50 3,15.20 HO S2 53 Othee Non Current Lines 54 Total Liabilities 55 56 Common Stock 57 Additional Paid in Capital 58 Retained Eag 59 Tasury Stock 60 Comprehensive ine and Other tol Total Common Equity 62 63 Mimony interest 64 65 Total Equity 66 Total Liabilities And Equity 6.B 69 Supplementales 70 To Share out on Balance Sheet Date 7 72 Market Price of Stock 73 74 75 00 20 1,645.0 1.373.0 1,1120 2,569.0 3.1540 7.7260 14,529.0 13.1480 12,3720 11,7340 3010 3010 3010 3020 3000 S40 20 $39.45 $4500 $5261 5473 Income Statement Balance Sheet Cash Flow G 13 Cash Flow Rostated 12 months Jul-30-2017 USO Restated 12 months Jul-29-2018 USD Rastated 12 months Jul-28-2019 USO Restated 12 months Aug-02-2020 USD 12 months Aug-01-2021 USO 887.0 1920 to 193.0 261.0 2590 200 279.0 211.0 3150 480 3030 1,628,0 2850 430 328.0 1.002.0 2750 420 317.0 110 For the Fiscal Period Ending 14 15 Currency 16 17 Net Income 18 Depocution & Amort 19 Anon of Goodwil and intangibles 20 Depreciation & Amort, Total 21 22 minston From Sale Of Assets 23 ans On Sale Of invest 24 Aset Wredown & Restructuring Costs 25 Slock Band Compensation 26 Net Cash From Discontinued Ops 27 Other Operating Activities 28 Change in Aco Recoratie 29 Change in inventores 20 Change in And Payablo 31 Change in the Net Operating Assets 32 Cash from Ops ES 34 Capital Expand (9750) 400 9.0 610 210 600 180 000 2850 (2000) 280 460 (480) (270) 1,236.0 100 1160 610 0140 (3000) 56.0 (340) 780 270 1.410.0 320 10 470 580 3120 770 (110) 380 1250 (10) 1,25000 2040 1300) (200) 1450 (0) 1.3900 1910) 200) (77.0) (1640) (280) 1,0350 3380) (4070) (3840) (29001 (2750) Income Statement Balance Sheet Cash Flow + Workbook Statistics Give Feed General B E (3380) (40703 0.781 01 100 D (3840) 14703 310 (2000) (11.09 25400 300 2750 12.00 1110 3001 (3660) (190) 7.1976) 5530 1530 60 227200 80 (1500) 5.000 3200 34 Cal Expenditure 35 Chagasi 36 Dis 37 west in Marble & Equity Securt 38 Nene Decans Ongnated Sold 39 One Active 40 Cash from investing 43 42 Short Term Debes 43 Long Term Dei 44 Total Debt issued 45 Son Tum Debt Repad 46 Cong Too Gottapod Total Debt Repaid 48 49 Huance of common stock 50 Reproof Corn Stock 51 52 Common donds Pad 53 Total Dividends Pad 56 55 Special Dividend Pand 56 Other France Advies 57 Cash from Financing 82470 2110 6458.0 0.0020) 40001 (4920) 10 2220 2240 AZO 9.9440 (630) (10.0070) 563976 10.2960 (700:09 (6.990.0) 56170 10000 6,6170 (69000) 22680 (9,177/0) 200 (530.03 19210 (1.501) 20 (45003 (1090) (80) 230 (120) 20 (510 (2009 (4200) (4260) (4260) (423) (42303 (42630) (439) 490 30 (908) (9700 5,8070 (10) (1.5910) (120) (2.687.00 (1.600) Income Statement Balance Sheet Cash Flow Arial BA General : 635 A D E F H B AM 18.002.0) (49000) 18,492.0) c NUM 19.0440) (03) (107007) 05.200.0) (7020) 69966) 5.9000) 02.2003 (170) (500.00 (210 21.501.0) 20 (45001 (1000) (30) 230 (120) 20 (570) (4200) (400) (4260) (426.0) (423.00 (42302 42801 (426.0) 439 4500 45 Short Term Dot Repaid 46 Long Term Repad 47 Total Debt Repaid 58 49 Istance of Common Stock 50 Repurchase of Common Stock 51 52 Common Dividonds Paid 53 Total Dividends Pald 54 55 Spool widend as 56 Che Frencing Activities> 57 Cash from Financing 58 59 Formon Exchange Rate Adi Net Change in Cash 61 62 63 64 65 56 67 68 m88 30 (908.0) (070 5,8070 (10) (1.591.0) (1201 (2.987.0) (1.6090) 110 129.0, 180 (70) (1950 120 (10) 680.0 20 1900 Additional Funds Needed Campbell wants to increase its sales/revenue after year 2021. A. What are the additional funds needed (AFN) if the company wants to grow sales/revenue by 4.5% after year 2021? B. What is the Internal Growth Rate? c. What is the Sustainable Growth Rate? B D G 2 LOCALELLIS For the Fiscal Period Ending Reclassified 12 months J-30-2017 USD Reclassified 12 months Jul-29-2018 USD 12 months J-28-2019 USD 12 months Aug-02-2020 USD 12 months Aug-01-2021 USD 5B30 66150 0,1070 86910 8,478,0 2542 5,8370 6,615.0 8.107.0 8.691.0 8.476.0 3,3910 2446.0 4,1540 2.461.0 5.398,0 2,7110 5,6830 3,008,0 5,6620 28140 15 Curry 16 17 Revo 18 Other Revenge 19 Total Revenue 20 21 Cost Of Cod Sold 22 Gross Profit 23 24 Seng Con A Admin Exp 25 R&DERD 26 Depreciation 6 Amort 27 Other Operating Expendincome) 28 29 Omer Operating Exp. Tot 30 31 Operating Income 32 33 Intorout Expono 34 rest trest Income 35 Net Interest Exp 1.000.0 93.0 1,1770 010 1,30 880 1.5190 920 1,3860 84.0 (2400) (2110) 1230 1060 (2660) 94370 1,0570 1.504.0 1.717.0 12040 1.503.0 1,4040 1.117,0 1,291.0 1.610.0 (1150) (1830) 30 (18070) (3560) 20 (3540) (3450) 40 (3410) (2100) 10 (209.0) (116.0) LII Income Statement Balance Sheet Cash Flow + Wonok Statistics Gefes C D E G H 15.01 TO (20) 1.373.0 1225.0 783.0 948.0 14000 (480 (1210) 100 DI 2020 (1070) 0902 co 1103 (90) 1640) 11 HE F170.03 A 32 Currency changes 38 Other Non-Operation 39 EDT Exc. Unsere 40 41 Penghar 42 Mera Holted Perut. Charge 43 of 44 Canos e 15 Canton Or Assis 46 Antal Window togalaam 48 Other EBT Ind Unusuwa 50 51 come To Expo 52 Earnings from Cant op 53 54 Loof Descador 55 Extron Account Change $6 Net income to Company 57 58 Montent in Las 59 Net Income 60 (540) 12200 (160) 1531650 BOO 6250 7660 1360 1000 3320 9240 1510 47400 1740 3820 1280 10080 (370) 4601 2030 10360 060 6670 2010 2110 1680 10020 Bayo 2510 2110 1626 T220 Income Statement Balance Sheet Cash Flow Worshock Statistics Give Esedback to MITO D G Jul-30-2017 USD Reclassified Jul-29-2018 USD Jul-28-2019 USO Aug-02-2020 USD Aug-01-2021 USD 3190 319,0 49.0 49.0 310 31.0 8500 859.0 600 69.0 5500 550 6050 5100 530 563.0 5250 690 5740 530,0 450 5750 5440 510 5950 33 Balance Sheet Balance sheet as ot 14 15 Currency 16 ASSETS 17 On Ad Equivalents 18 Total Cash & ST Investments 19 20 Accounts Receivati 21 Other Recorable Total Receivables 22 24 ory 25 Ost Current Assets 26 Total Current Asset 22 28 Cross Property Plant & Equipment 20 Accumulated Depreciation 20 Net Property. Plant & Equipment 31 32 Longform investments 33 Good 34 Other Infantiles 35 Deferred Tax Asses LT 25 Other Long Term Assis 3870 9020 740 TSKO 7970 3030 4900 1.6670 871.0 800 23365.0 9330 900 1,696,0 22 6.000 (3.5890) 2.454.0 52100 (2.7730) 24600 52150 12.700 2.455.0 5.5390 20170) 2,6220 5,7240 3.110 01 2.605.0 600 2 1150 11180 360 340 900 3.8640 3.6640 20 2,1450 720 40170 34150 3.906.0 3.350.0 3,9010 32390 12170 290 2140 Income Statement Balance Sheet Cash Flow Walati 8 D E F G 770 40170 34150 3,9860 3,350.0 35010 12300 090 2,1150 1.1180 VO 340 TR20 920 38640 30040 20 2.145.0 14,1290 1 2170 EXO 280 TFPZO 2140 ITTO A 21 32 Longlor investments 33 Goodwill 34 Cew Intangibles 35 Dolored Tak A.LT 36 Other Long Term Assas 37 Total Assets 38 39 LIABILITIES 40 Accounts Payable 41 Accrued Exp 42 Short to borrowing 43 Cr Port of LT Debt 44 C Portofte 45 Cur income Tax Payne 46 Other Curront bites 47 Total Current Liabilities 48 49 Cong Term Dett 50 Long Term Les 51 Person Other Posters 52 Our tably, Mon Cute 53 Other Non-currencias 54 Total Lines 55 7050 4040 1.1350 3000 1000 5130 370 0600 4940 1,0300 220 10 200 1500 2,305.0 3140 5720 8500 5000 210 150 6130 3,3850 1,000 0030 2100 9210 700 240 1300 376750 100 3000 36940 650 50 1240 1,8740 7.0010 24120 70 5000 4000 1800 6.0810 7,1010 20 3890 9240 2350 12.036.0 49900 1600 4000 6140 3470 3600 2640 13,156,0 50000 1680 410 10510 1840 8.580.0 1140 978030 Income Statement Balance Sheet Cash Flow ALL f B H 1896 6.081.0 MONU 2640 13.1560 D NU 2350 12.033.0 10 1740 0.803.0 1840 8.580.0 120 3500 2,3850 (1.066.09 (530) 176370 120 3490 2.2240 (1,1030) (1180) 1.3640 120 3720 1.9930 (1.0760) (1980) 1.10370 120 3040 3.1000 4.02309 (100) 2.56370 120 410 3.7420 11 0210 50 3,15.20 HO S2 53 Othee Non Current Lines 54 Total Liabilities 55 56 Common Stock 57 Additional Paid in Capital 58 Retained Eag 59 Tasury Stock 60 Comprehensive ine and Other tol Total Common Equity 62 63 Mimony interest 64 65 Total Equity 66 Total Liabilities And Equity 6.B 69 Supplementales 70 To Share out on Balance Sheet Date 7 72 Market Price of Stock 73 74 75 00 20 1,645.0 1.373.0 1,1120 2,569.0 3.1540 7.7260 14,529.0 13.1480 12,3720 11,7340 3010 3010 3010 3020 3000 S40 20 $39.45 $4500 $5261 5473 Income Statement Balance Sheet Cash Flow G 13 Cash Flow Rostated 12 months Jul-30-2017 USO Restated 12 months Jul-29-2018 USD Rastated 12 months Jul-28-2019 USO Restated 12 months Aug-02-2020 USD 12 months Aug-01-2021 USO 887.0 1920 to 193.0 261.0 2590 200 279.0 211.0 3150 480 3030 1,628,0 2850 430 328.0 1.002.0 2750 420 317.0 110 For the Fiscal Period Ending 14 15 Currency 16 17 Net Income 18 Depocution & Amort 19 Anon of Goodwil and intangibles 20 Depreciation & Amort, Total 21 22 minston From Sale Of Assets 23 ans On Sale Of invest 24 Aset Wredown & Restructuring Costs 25 Slock Band Compensation 26 Net Cash From Discontinued Ops 27 Other Operating Activities 28 Change in Aco Recoratie 29 Change in inventores 20 Change in And Payablo 31 Change in the Net Operating Assets 32 Cash from Ops ES 34 Capital Expand (9750) 400 9.0 610 210 600 180 000 2850 (2000) 280 460 (480) (270) 1,236.0 100 1160 610 0140 (3000) 56.0 (340) 780 270 1.410.0 320 10 470 580 3120 770 (110) 380 1250 (10) 1,25000 2040 1300) (200) 1450 (0) 1.3900 1910) 200) (77.0) (1640) (280) 1,0350 3380) (4070) (3840) (29001 (2750) Income Statement Balance Sheet Cash Flow + Workbook Statistics Give Feed General B E (3380) (40703 0.781 01 100 D (3840) 14703 310 (2000) (11.09 25400 300 2750 12.00 1110 3001 (3660) (190) 7.1976) 5530 1530 60 227200 80 (1500) 5.000 3200 34 Cal Expenditure 35 Chagasi 36 Dis 37 west in Marble & Equity Securt 38 Nene Decans Ongnated Sold 39 One Active 40 Cash from investing 43 42 Short Term Debes 43 Long Term Dei 44 Total Debt issued 45 Son Tum Debt Repad 46 Cong Too Gottapod Total Debt Repaid 48 49 Huance of common stock 50 Reproof Corn Stock 51 52 Common donds Pad 53 Total Dividends Pad 56 55 Special Dividend Pand 56 Other France Advies 57 Cash from Financing 82470 2110 6458.0 0.0020) 40001 (4920) 10 2220 2240 AZO 9.9440 (630) (10.0070) 563976 10.2960 (700:09 (6.990.0) 56170 10000 6,6170 (69000) 22680 (9,177/0) 200 (530.03 19210 (1.501) 20 (45003 (1090) (80) 230 (120) 20 (510 (2009 (4200) (4260) (4260) (423) (42303 (42630) (439) 490 30 (908) (9700 5,8070 (10) (1.5910) (120) (2.687.00 (1.600) Income Statement Balance Sheet Cash Flow Arial BA General : 635 A D E F H B AM 18.002.0) (49000) 18,492.0) c NUM 19.0440) (03) (107007) 05.200.0) (7020) 69966) 5.9000) 02.2003 (170) (500.00 (210 21.501.0) 20 (45001 (1000) (30) 230 (120) 20 (570) (4200) (400) (4260) (426.0) (423.00 (42302 42801 (426.0) 439 4500 45 Short Term Dot Repaid 46 Long Term Repad 47 Total Debt Repaid 58 49 Istance of Common Stock 50 Repurchase of Common Stock 51 52 Common Dividonds Paid 53 Total Dividends Pald 54 55 Spool widend as 56 Che Frencing Activities> 57 Cash from Financing 58 59 Formon Exchange Rate Adi Net Change in Cash 61 62 63 64 65 56 67 68 m88 30 (908.0) (070 5,8070 (10) (1.591.0) (1201 (2.987.0) (1.6090) 110 129.0, 180 (70) (1950 120 (10) 680.0 20 1900