Additional information:
1. | | The market price of Jergans common stock was $7.00, $7.50, and $8.50 for 2018, 2019, and 2020, respectively. |
2. | | You must compute dividends paid. All dividends were paid in cash. |
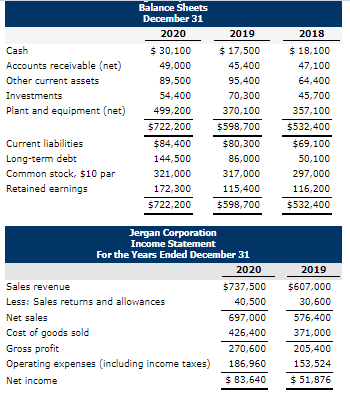
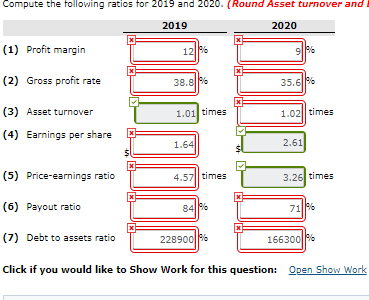
Balance Sheets 31 2019 2020 30,100 49,000 89,500 54,400 499,200 5722,200 $84,400 144,500 321,000 172,300 5722,200 2018 Cash Accounts receivable (net) Other current assets 17,500 $18,100 45,400 95,400 70,300 47,100 64,400 45,700 357,100 $532,400 $69,100 50,100 297,000 116,200 5532,400 Plant and equipment 370,100 $598,700 $80,300 Current liabilities Long-term debt Common stock, $10 par Retained earnings 86,000 317,000 115,400 $598,700 Jergan Corporation Income Statement For the Years Ended 2020 2019 Sales revenue Less: Sales retums and allowances Net sales Cost of goods sold Gross proft Operating expenses (including income taxes) Net income 300 $607,000 40,500 697,000 426,400 270,600 186,960 $83,640 30,600 576,400 371,000 205,400 153,524 S 51,876 Compute the tollowing ratios for 2019 and 2020. (Round Asset turnover and 2019 2020 (1) Profit margin (2) Gross profit rate (3) Asset turnover (4) Earnings per share 38 35 1.01 times 1.02 times 2.61 im (5) Price-earnings ratio (6) Payout ratio (7) Debt to assets ratio Click if you would like to Show Work for this question: 4.57 times 71 22890 166300 Open Show Work Balance Sheets 31 2019 2020 30,100 49,000 89,500 54,400 499,200 5722,200 $84,400 144,500 321,000 172,300 5722,200 2018 Cash Accounts receivable (net) Other current assets 17,500 $18,100 45,400 95,400 70,300 47,100 64,400 45,700 357,100 $532,400 $69,100 50,100 297,000 116,200 5532,400 Plant and equipment 370,100 $598,700 $80,300 Current liabilities Long-term debt Common stock, $10 par Retained earnings 86,000 317,000 115,400 $598,700 Jergan Corporation Income Statement For the Years Ended 2020 2019 Sales revenue Less: Sales retums and allowances Net sales Cost of goods sold Gross proft Operating expenses (including income taxes) Net income 300 $607,000 40,500 697,000 426,400 270,600 186,960 $83,640 30,600 576,400 371,000 205,400 153,524 S 51,876 Compute the tollowing ratios for 2019 and 2020. (Round Asset turnover and 2019 2020 (1) Profit margin (2) Gross profit rate (3) Asset turnover (4) Earnings per share 38 35 1.01 times 1.02 times 2.61 im (5) Price-earnings ratio (6) Payout ratio (7) Debt to assets ratio Click if you would like to Show Work for this question: 4.57 times 71 22890 166300 Open Show Work