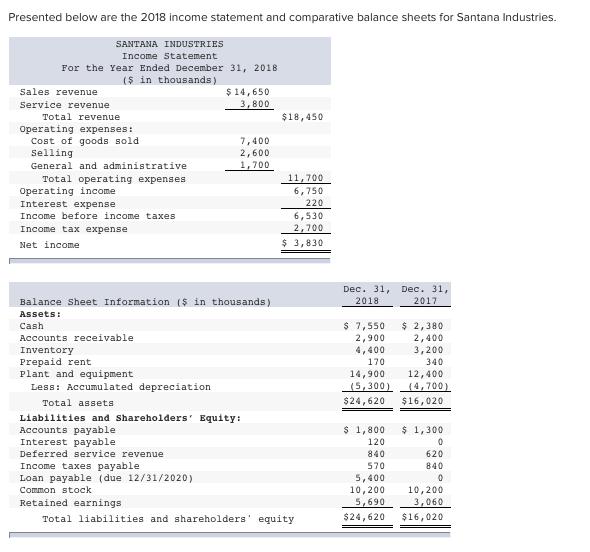
Presented below are the 2018 income statement and comparative balance sheets for Santana Industries. SANTANA INDUSTRIES Income Statement For the Year Ended December 31,


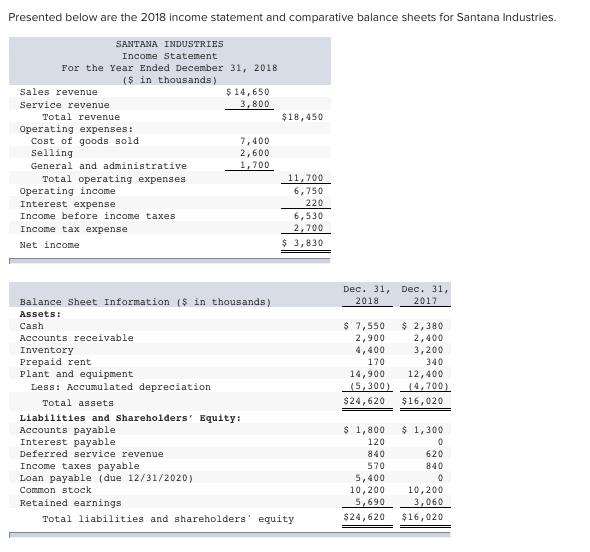
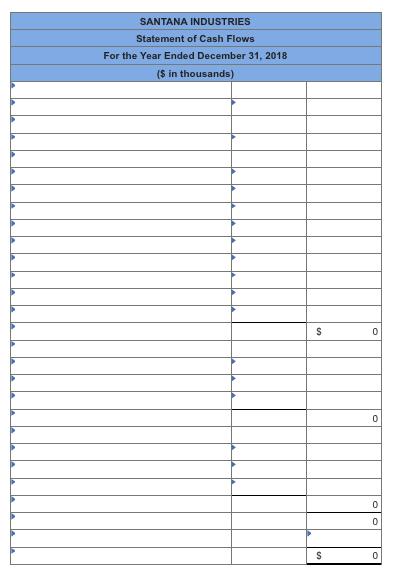
Presented below are the 2018 income statement and comparative balance sheets for Santana Industries. SANTANA INDUSTRIES Income Statement For the Year Ended December 31, 2018 ($ in thousands) Sales revenue Service revenue Total revenue Operating expenses: Cost of goods sold. Selling General and administrative Total operating expenses Operating income Interest expense Income before income taxes Income tax expense Net income $ 14,650 3,800 7,400 2,600 1,700 Balance Sheet Information ($ in thousands) Assets: Cash Accounts receivable Inventory Prepaid rent Plant and equipment Less: Accumulated depreciation Total assets Liabilities and Shareholders' Equity: Accounts payable Interest payable Deferred service revenue $18,450 11,700 6,750 220 6,530 2,700 $ 3,830 Income taxes payable Loan payable (due 12/31/2020) Common stock Retained earnings Total liabilities and shareholders' equity Dec. 31, 2018 $ 7,550 2,900 4,400 170 14,900 (5,300) $24,620 $ 1,800 120 840 570 Dec. 31, 2017 $ 2,380 2,400 3,200 340 12,400 (4,700) $16,020 $ 1,300 0 620 840 0 5,400 10,200 10,200 5,690 3,060 $24,620 $16,020 Presented below are the 2018 income statement and comparative balance sheets for Santana Industries. SANTANA INDUSTRIES Income Statement For the Year Ended December 31, 2018 ($ in thousands) Sales revenue Service revenue Total revenue Operating expenses: Cost of goods sold. Selling General and administrative Total operating expenses Operating income Interest expense Income before income taxes Income tax expense Net income $ 14,650 3,800 7,400 2,600 1,700 Balance Sheet Information ($ in thousands) Assets: Cash Accounts receivable Inventory Prepaid rent Plant and equipment Less: Accumulated depreciation Total assets Liabilities and Shareholders' Equity: Accounts payable Interest payable Deferred service revenue $18,450 11,700 6,750 220 6,530 2,700 $ 3,830 Income taxes payable Loan payable (due 12/31/2020) Common stock Retained earnings Total liabilities and shareholders' equity Dec. 31, 2018 $ 7,550 2,900 4,400 170 14,900 (5,300) $24,620 $ 1,800 120 840 570 Dec. 31, 2017 $ 2,380 2,400 3,200 340 12,400 (4,700) $16,020 $ 1,300 0 620 840 0 5,400 10,200 10,200 5,690 3,060 $24,620 $16,020 Additional information for the 2018 fiscal year ($ in thousands): 1. Cash dividends of $1,200 were declared and paid. 2. Equipment costing $4,400 was purchased with cash. 3. Equipment with a book value of $700 (cost of $1,900 less accumulated depreciation of $1,200) was sold for $700. 4. Depreciation of $1,800 is included in operating expenses. Required: Prepare Santana Industries 2018 statement of cash flows, using the indirect method to present cash flows from operating activities. (Amounts to be deducted should be indicated with a minus sign. Enter your answers in thousands.) SANTANA INDUSTRIES Statement of Cash Flows For the Year Ended December 31, 2018 ($ in thousands) S S 0 0 0 0 0
Step by Step Solution
3.46 Rating (159 Votes )
There are 3 Steps involved in it
Step: 1
Santana Industries Statement of Cash Flows For the Year ended December 31 2021 Particulars Details Amount Cash Flow from Operating Activities Net Inco...
See step-by-step solutions with expert insights and AI powered tools for academic success
Step: 2

Step: 3

Document Format ( 2 attachments)
635e12870e1fc_181210.pdf
180 KBs PDF File
635e12870e1fc_181210.docx
120 KBs Word File
Ace Your Homework with AI
Get the answers you need in no time with our AI-driven, step-by-step assistance
Get Started


