Additional information gathered for the analysis reveals that the selling price per unit of product is $8.00 and the sales force earns a 10% commission for each unit sold. The accountant also found that other administrative and selling expenses are fixed at $1,562 per week.
Caroll does not carry inventory and, therefore, the number of units produced is equal to the number of units sold. Income information for three weeks is as follows:
Notice that cost of goods sold (COGS) per unit changes depending on output volume. At 800 units sold, COGS per unit is $4.58. At 1,000 units sold, COGS per unit is $4.22. At 1,200 units sold, COGS per unit is $3.98.
The cost accountant observed that the COGS per unit declined as production volume increased. The analysis was used to support pricing decisions at Caroll Manufacturing.
The completed cost analysis used the average three-week production volume to determine the cost of production to be $6.58 per unit. The per-unit cost was also assumed to be the break-even cost, which was used to develop guidelines for the sales force.
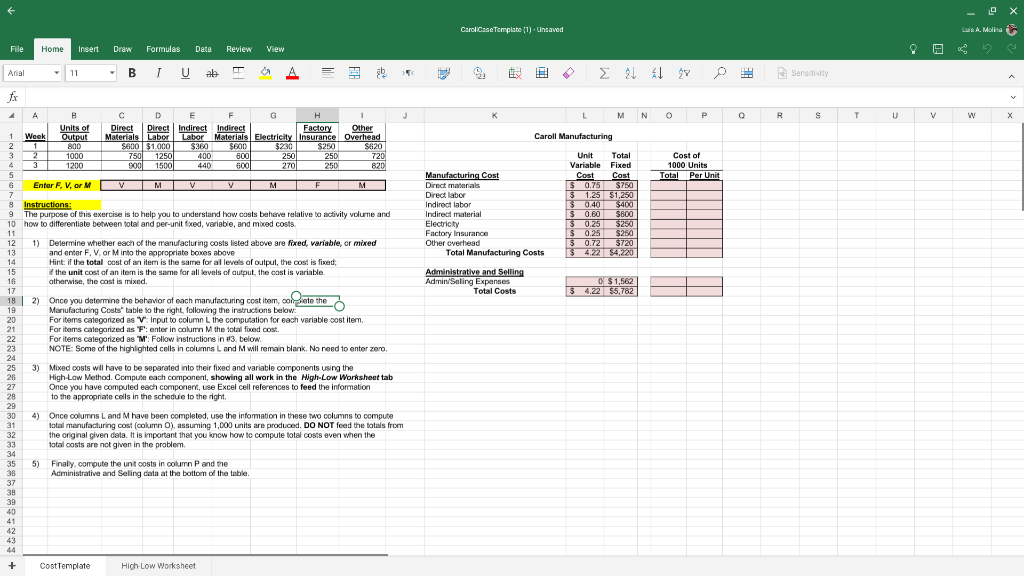
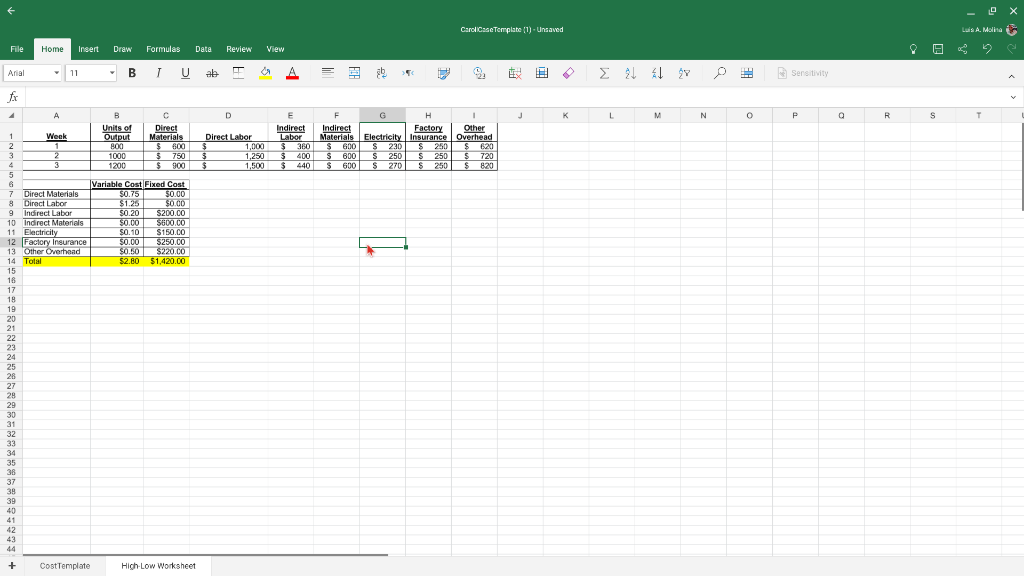
X Carol Case Template (1) - Unsaved Luis A. Molla File Home Insert Draw Formulas Data Review View 21 All Y o Sensitivity K L M N P Q R S T U v W X Caroll Manufacturing Cost of 1000 Units Total Per Unit $ 0.75 376 Manufacturing Cost Direct materials Direct labor Indirect labo Indirect material Electricity Factory Insurance Other overhead Total Manufacturing Costs Administrative and selling Admin/Seling Expenses Total Costs Unit Total Variable Fixed Cost Cost $750 $ 1.25 $1.25 $ 0.40 $400 $ 0.60 $600 0.25 $250 $ 0.25 $250 $ 0.72 $720 $4.22 $4,220 0 $1,562 $ 4.22 35.782 Arial T 11 - B Bu al fx 4 A B D F F G H Units of Direct Direct Indirect Indirect Factory 1 Other Week Output Materials | Labor Electricity Insurance AS 2 11 800 $600 $1,000 $300 $600 $230 $250 $620 3 2 1000 750 1250 400 6001 2501 250 720 3 1200 500 1500 440 6001 2701 250 820 5 6 Enter F, V, or M VMVVMFM 7 8 Instructions : 9 The purpose of this exercise is to help you to understand how costs behave relative to activity volume and 10 how to differentiate between total and per-unit fixed, variable, and med costs 11 12 1) Determine whether each of the manufacturing costs listed above are fixed, variable, or mixed 13 and enter F. V or Minto the appropriate boxes above 14 Hint: if the total cost of an item is the same for all levels of output, the cost is fixed; 15 if the unit cost of an item is the same for all levels of output, the cost is variable. 16 atherwise, the cost is mixed. 17 18 2) Once you determine the behavior of each manufacturing cost item, colete the 19 Manufacturing Costs" table to the right, following the instructions below: 20 For items categorized as V: Input to column L the computation for each variable cost item. 21 For items categorized as "F: enter in column M the total fixed cost. 22 For items categorized as "M': Follow instructions in 83. below. 23 NOTE: Some of the highlighted cells in columns L and M will remain blank. No need to enter zero. 24 25 3) Mixed costs will have to be separated into their fixed and variable components using the 26 High-Low Method. Compute each component, showing all work in the High-Low Worksheet tab 27 Once you have computed each component, use Excel cell references to feed the information 28 to the appropriate cells in the schedue to the right 29 30 4) Once columns Land M have been completed, use the information in these two columns to compute 31 total manufacturing cost column O), assurning 1,000 units are produced. DO NOT feed the totals from 32 the original given data. It is important that you know how to compute total costs even when the 33 total costs are not given in the problem 34 35 5) Finally, compute the unit costs in column P and the 36 Administrative and Sling data at the bottom of the table 37 38 39 40 41 42 43 44 + CostTemplate High-Low Worksheet X Carol Case Template (0) - Unawed Luis A. Molina File Home Insert Draw Formulas Data Review View Arial T - 11 - B BIU E 21 AL Y o Sensitivity fx 4 A K L M N 0 P Q R S Other B C D E G H Units of Direct Indirect Indirect Factory Output Materials Direct Labor Labor Materiale Electricity Insurance Overhead 800 $ 600 $ 1,000 $360 S 600 S 280 S 250 $ 620 1000 $ 750 3 1.250 3 400 $ 600 S 250 $ 250 $ 720 1200 $900 $ 1,500 $ 440 $ 600 $ 270 $ 22 250 $ 820 Variable Cost Fixed Cost 50.75 30.00 $1.250.00 $0.20 $200.00 S0.00 $600.00 $0.10 $150.00 $0.00 $250.00 $0.50 $220.00 $2.80 51.420,00 1 Week 2 2 3 2 4 3 5 6 7 Direct Materials 8 Direct Labor 9 9 Indirect Labor 10 Indirect Materiels 11 Electricity 12 Factory Insurance 13 Other Overhead 14 Total 15 18 17 18 19 20 21 22 23 24 25 26 27 28 29 30 31 32 33 34 35 38 37 38 39 40 41 42 43 CostTemplate High-Low Worksheet