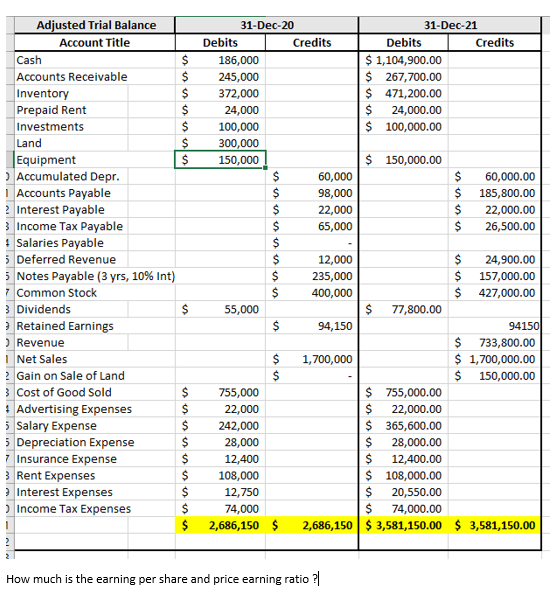
Adjusted Trial Balance Account Title Cash $ Accounts Receivable $ Inventory $ Prepaid Rent $ Investments $ Land $ Equipment $ Accumulated Depr. 1 Accounts Payable 2 Interest Payable 3 Income Tax Payable Salaries Payable Deferred Revenue 5 Notes Payable (3 yrs, 10% Int) 7 Common Stock 3 Dividends $ Retained Earnings Revenue Net Sales ? Gain on Sale of Land 3 Cost of Good Sold $ Advertising Expenses $ Salary Expense $ 5 Depreciation Expense S 7 Insurance Expense $ 3 Rent Expenses S Interest Expenses $ ) Income Tax Expenses $ $ 2 31-Dec-20 31-Dec-21 Debits Credits Debits Credits 186,000 $ 1,104,900.00 245,000 $ 267,700.00 372,000 $ 471,200.00 24,000 $ 24,000.00 100,000 $ 100,000.00 300,000 150,000 $ 150,000.00 $ 60,000 $ 60,000.00 $ 98,000 $ 185,800.00 $ 22,000 $ 22,000.00 $ 65,000 $ 26,500.00 $ $ 12,000 $ 24,900.00 $ 235,000 $ 157,000.00 $ 400,000 $ 427,000.00 55,000 $ 77,800.00 $ 94,150 94150 $ 733,800.00 $ 1,700,000 $ 1,700,000.00 $ $ 150,000.00 755,000 $ 755,000.00 22,000 $ 22,000.00 242,000 $365,600.00 28,000 $ 28,000.00 12,400 $ 12,400.00 108,000 $ 108,000.00 12,750 $ 20,550.00 74,000 $ 74,000.00 2,686,150 $ 2,686,150 $3,581,150.00 $ 3,581,150.00 $ 1 How much is the earning per share and price earning ratio ? Adjusted Trial Balance Account Title Cash $ Accounts Receivable $ Inventory $ Prepaid Rent $ Investments $ Land $ Equipment $ Accumulated Depr. 1 Accounts Payable 2 Interest Payable 3 Income Tax Payable Salaries Payable Deferred Revenue 5 Notes Payable (3 yrs, 10% Int) 7 Common Stock 3 Dividends $ Retained Earnings Revenue Net Sales ? Gain on Sale of Land 3 Cost of Good Sold $ Advertising Expenses $ Salary Expense $ 5 Depreciation Expense S 7 Insurance Expense $ 3 Rent Expenses S Interest Expenses $ ) Income Tax Expenses $ $ 2 31-Dec-20 31-Dec-21 Debits Credits Debits Credits 186,000 $ 1,104,900.00 245,000 $ 267,700.00 372,000 $ 471,200.00 24,000 $ 24,000.00 100,000 $ 100,000.00 300,000 150,000 $ 150,000.00 $ 60,000 $ 60,000.00 $ 98,000 $ 185,800.00 $ 22,000 $ 22,000.00 $ 65,000 $ 26,500.00 $ $ 12,000 $ 24,900.00 $ 235,000 $ 157,000.00 $ 400,000 $ 427,000.00 55,000 $ 77,800.00 $ 94,150 94150 $ 733,800.00 $ 1,700,000 $ 1,700,000.00 $ $ 150,000.00 755,000 $ 755,000.00 22,000 $ 22,000.00 242,000 $365,600.00 28,000 $ 28,000.00 12,400 $ 12,400.00 108,000 $ 108,000.00 12,750 $ 20,550.00 74,000 $ 74,000.00 2,686,150 $ 2,686,150 $3,581,150.00 $ 3,581,150.00 $ 1 How much is the earning per share and price earning ratio