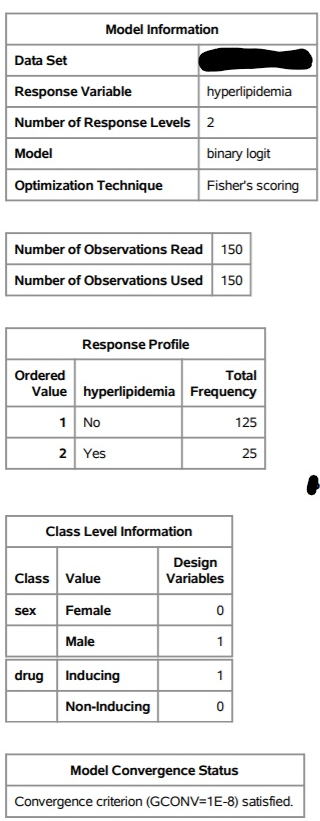
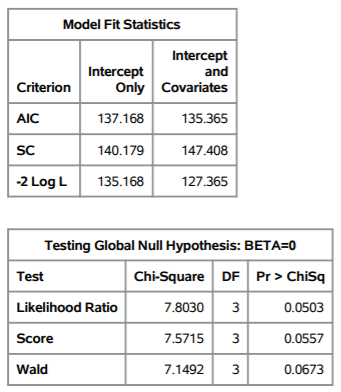
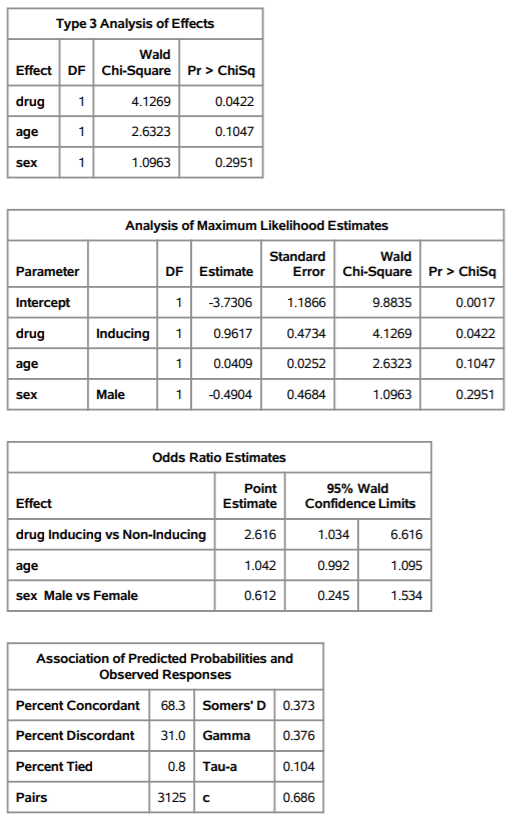
Adults with epilepsy are recruited into a clinical trial to compare the effect of two classes of anticonvulsant drugsenzyme-inducing and non-enzyme-inducing on serum lipids. The outcome of interest is a new diagnosis of hyperlipidemia. Use the output to answer the following questions.
-
- What procedure was used to generate the results in SAS?
-
- Is there sufficient evidence to suggest that drug class is associated with hyperlipidemia? Justify your response.
-
- Are any of the independent variables included in the model categorical? If so which ones? Justify your response.
-
- Are age and sex associated with hyperlipidemia? Justify your response.


Model Information Data Set Response Variable hyperlipidemia Number of Response Levels 2 Model binary logit Optimization Technique Fisher's scoring Number of Observations Read 150 Number of Observations Used 150 Response Profile Ordered Total Value hyperlipidemia Frequency 1 No 125 2 Yes 25 Class Level Information Class Value Design Variables sex Female 0 Male 1 1 drug Inducing Non-Inducing 0 Model Convergence Status Convergence criterion (GCONV=1E-8) satisfied. Model Fit Statistics Intercept Intercept and Only Covariates Criterion AIC 137.168 135.365 SC 140.179 147.408 -2 Log L 135.168 127.365 Testing Global Null Hypothesis: BETA=0 Test Chi-Square DF Pr > Chisq Likelihood Ratio 7.8030 0.0503 Score 7.5715 0.0557 Wald 7.1492 0.0673 Type 3 Analysis of Effects Wald Effect DF Chi-Square Pr > Chisq drug 4.1269 0.0422 age 2.6323 0.1047 1.0963 0.2951 1 sex 1 Analysis of Maximum Likelihood Estimates Parameter DF Estimate -3.7306 Intercept 1 Standard Wald Error Chi-Square Pr > Chisq 1.1866 9.8835 0.0017 0.4734 4.1269 0.0422 0.0252 2.6323 0.1047 drug Inducing 1 0.9617 age 0.0409 sex Male -0.4904 0.4684 1.0963 0.2951 Odds Ratio Estimates Point Estimate 2.616 Effect drug Inducing vs Non-Inducing age sex Male vs Female 95% Wald Confidence Limits 1.034 6.616 0.992 1.095 0.245 1.534 1.042 0.612 Association of Predicted Probabilities and Observed Responses Percent Concordant 68.3 Somers' D 0.373 Percent Discordant 31.0 Gamma Percent Tied 0.8 Tau-a 0.104 0.376 Pairs 3125 c 0.686 Model Information Data Set Response Variable hyperlipidemia Number of Response Levels 2 Model binary logit Optimization Technique Fisher's scoring Number of Observations Read 150 Number of Observations Used 150 Response Profile Ordered Total Value hyperlipidemia Frequency 1 No 125 2 Yes 25 Class Level Information Class Value Design Variables sex Female 0 Male 1 1 drug Inducing Non-Inducing 0 Model Convergence Status Convergence criterion (GCONV=1E-8) satisfied. Model Fit Statistics Intercept Intercept and Only Covariates Criterion AIC 137.168 135.365 SC 140.179 147.408 -2 Log L 135.168 127.365 Testing Global Null Hypothesis: BETA=0 Test Chi-Square DF Pr > Chisq Likelihood Ratio 7.8030 0.0503 Score 7.5715 0.0557 Wald 7.1492 0.0673 Type 3 Analysis of Effects Wald Effect DF Chi-Square Pr > Chisq drug 4.1269 0.0422 age 2.6323 0.1047 1.0963 0.2951 1 sex 1 Analysis of Maximum Likelihood Estimates Parameter DF Estimate -3.7306 Intercept 1 Standard Wald Error Chi-Square Pr > Chisq 1.1866 9.8835 0.0017 0.4734 4.1269 0.0422 0.0252 2.6323 0.1047 drug Inducing 1 0.9617 age 0.0409 sex Male -0.4904 0.4684 1.0963 0.2951 Odds Ratio Estimates Point Estimate 2.616 Effect drug Inducing vs Non-Inducing age sex Male vs Female 95% Wald Confidence Limits 1.034 6.616 0.992 1.095 0.245 1.534 1.042 0.612 Association of Predicted Probabilities and Observed Responses Percent Concordant 68.3 Somers' D 0.373 Percent Discordant 31.0 Gamma Percent Tied 0.8 Tau-a 0.104 0.376 Pairs 3125 c 0.686


