

Question: ADVANCED BUSINESS STATISTICS HOMEWORK Prepare a bar chart for the data in the following table. This hypothetical table shows the number of home runs hit
ADVANCED BUSINESS STATISTICS
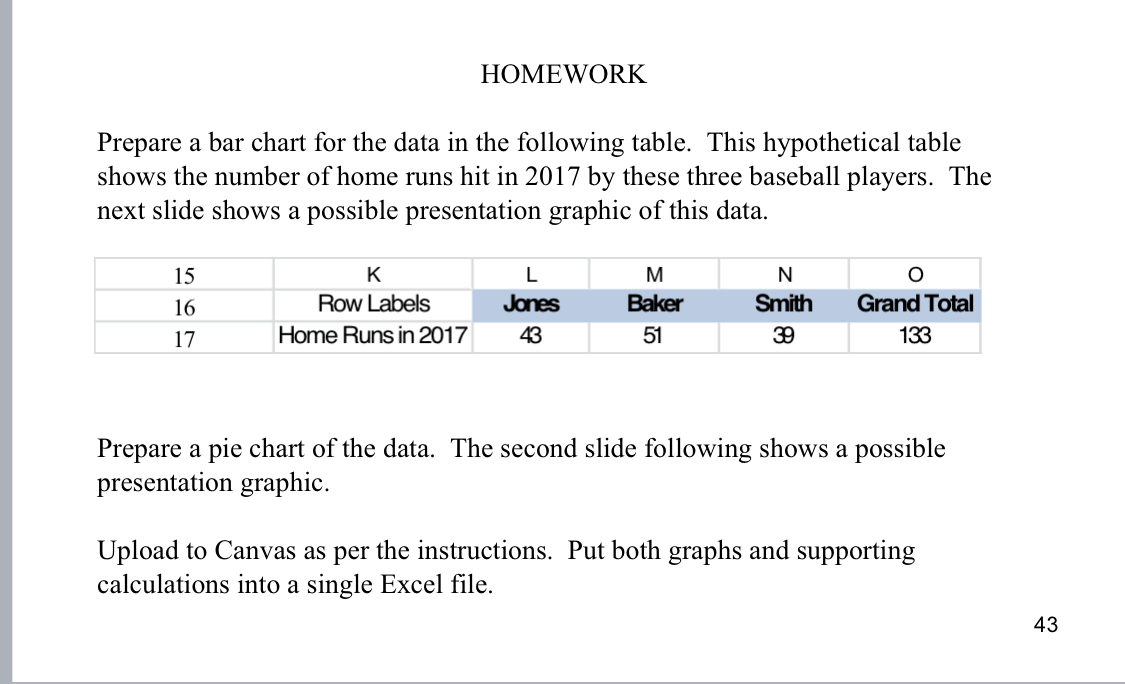
HOMEWORK Prepare a bar chart for the data in the following table. This hypothetical table shows the number of home runs hit in 2017 by these three baseball players. The next slide shows a possible presentation graphic of this data. 15 us mm 17 HomeRms In 2017 Prepare a pie chart of the data. The second slide following shows a possible presentation graphic. Upload to Canvas as per the instructions. Put both graphs and supporting calculations into a single Excel le. 43
Step by Step Solution
There are 3 Steps involved in it
1 Expert Approved Answer
Step: 1 Unlock

Question Has Been Solved by an Expert!
Get step-by-step solutions from verified subject matter experts
Step: 2 Unlock
Step: 3 Unlock