

Answered step by step
Verified Expert Solution
Question
1 Approved Answer
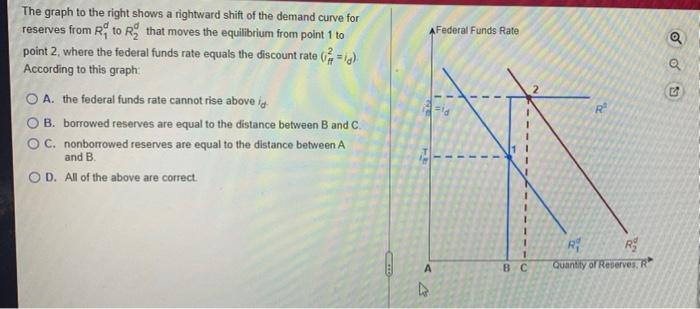
AFederal Funds Rate The graph to the right shows a rightward shift of the demand curve for reserves from R to that moves the equilibrium
Step by Step Solution
There are 3 Steps involved in it
Step: 1

Get Instant Access to Expert-Tailored Solutions
See step-by-step solutions with expert insights and AI powered tools for academic success
Step: 2

Step: 3
Ace Your Homework with AI
Get the answers you need in no time with our AI-driven, step-by-step assistance
Get Started
The Future Of Money How The Digital Revolution Is Transforming Currencies And Finance
Authors: Eswar S. Prasad
1st Edition
0674258444, 978-0674258440