Answered step by step
Verified Expert Solution
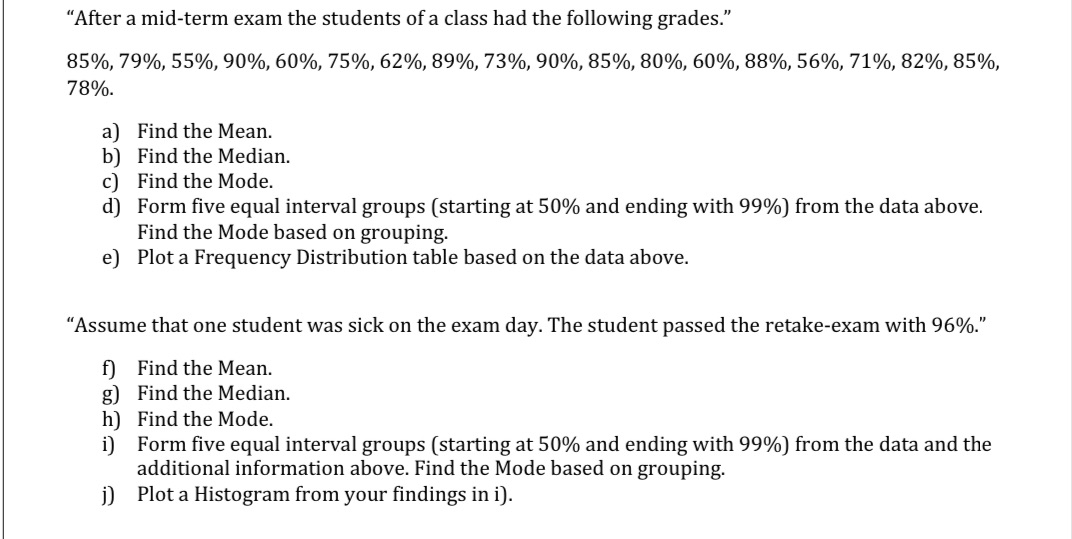
Link Copied!

Question

1 Approved Answer

After a mid-term exam the students of a class had the following grades. 85%, 79%, 55%, 90%, 60%, 75%, 62%, 9%, 3%, 90%, 85%, 0%,

image text in transcribed

image text in transcribed
"After a mid-term exam the students of a class had the following grades." 85%, 79%, 55%, 90%, 60%, 75%, 62%, "9%, 3%, 90%, 85%, 0%, 60%,88%, 56%, 71%, 82%, 85%, 78%. a) Find the Mean. b) Find the Median. c) Find the Mode. d) Form ve equal interval groups (starting at 50% and ending with 99%] from the data above. Find the Mode based on grouping. e) Plot a Frequency Distribution table based on the data above. "Assume that one student was sick on the exam day. The student passed the retake-exam with 96%." f) Find the Mean. g) Find the Median. h] Find the Mode. i] Form ve equal interval groups (starting at 50% and ending with 99%] from the data and the additional information above. Find the Mode based on grouping. j] Plot a Histogram from your ndings in i]

Step by Step Solution

There are 3 Steps involved in it

Step: 1

blur-text-image

Get Instant Access to Expert-Tailored Solutions

See step-by-step solutions with expert insights and AI powered tools for academic success

Step: 2

blur-text-image

Step: 3

blur-text-image

Ace Your Homework with AI

Get the answers you need in no time with our AI-driven, step-by-step assistance

Get Started

Recommended Textbook for

Precalculus Functions And Graphs

Authors: William G Zikmund, Earl Swokowski, Jeffery Cole

11th Edition

1111798532, 9781111798536

More Books

Students also viewed these Mathematics questions