After reading Exhibit 1 and Exhibit 2.
1. Analyze the financial performance of the company.
2. what is the near-term future?
3. analyze on financial management aspect?
4. Assessment of capital budgeting?
5. Managerial Aspects ?
This is a question from strategic management and all the analysis is done accordingly.
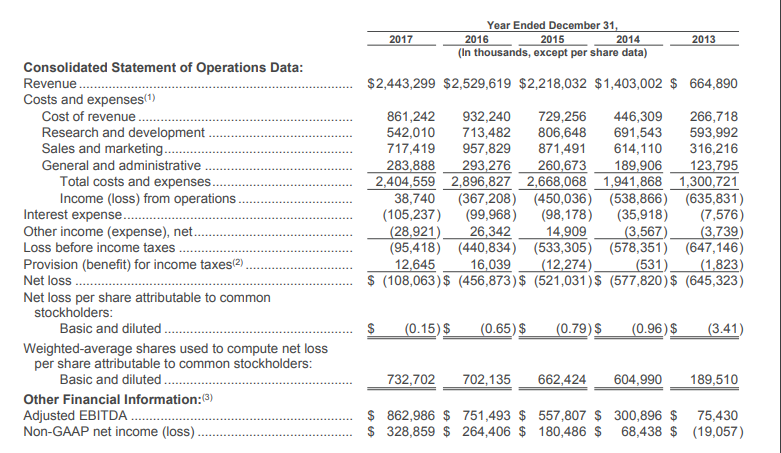
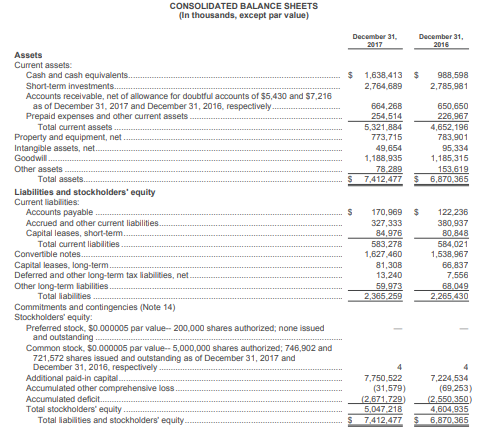
2017 Year Ended December 31, 2016 2015 2014 (In thousands, except per share data) 2013 $2,443,299 $2,529,619 $2,218,032 $1,403,002 $ 664,890 Consolidated Statement of Operations Data: Revenue... Costs and expenses(1) Cost of revenue Research and development. Sales and marketing.. General and administrative Total costs and expenses Income (loss) from operations Interest expense... Other income (expense), net. Loss before income taxes Provision (benefit) for income taxes(2) Net loss Net loss per share attributable to common stockholders: Basic and diluted... Weighted average shares used to compute net loss per share attributable to common stockholders: Basic and diluted ...... Other Financial Information:(3) Adjusted EBITDA Non-GAAP net income (loss) 861,242 932,240 729,256 446,309 266,718 542,010 713,482 806,648 691,543 593,992 717,419 957,829 871,491 614,110 316,216 283,888 293,276 260,673 189,906 123,795 2,404,559 2,896,827 2,668,068 1,941,868 1,300,721 38,740 (367,208) (450,036) (538,866) (635,831) (105,237) (99,968) (98,178) (35,918) (7,576) (28,921) 26,342 14,909 (3,567 (3.739) (95,418) (440,834) (533,305) (578,351) (647,146) 12,645 16,039 (12,274) (531) (1,823) $ (108,063) $ (456,873) $ (521,031) $ (577,820) $ (645,323) $ (0.15) $ (0.65)$ (0.79) $ (0.96) $ (3.41) 732,702 702,135 662,424 604,990 189,510 $ 862,986 $ 751,493 $ 557,807 $ 300,896 $ 75,430 $ 328,859 $ 264,406 $ 180,486 $ 68,438 $ (19,057) CONSOLIDATED BALANCE SHEETS (In thousands, except par value) December 31, 2017 December 31, 2016 $ 1,638,413 $ 2,764,689 988 598 2,785.981 664,266 254,514 5,321,884 773,715 49,654 1,188,935 78.289 7,412,477 650.650 226,967 4,652.196 783.901 95,334 1,185,315 153.619 6,870 365 $ Assets Current assets: Cash and cash equivalents. Short-term investments.. Accounts receivable, net of allowance for doubtful accounts of $5,430 and $7.216 as of December 31, 2017 and December 31, 2016, respectively Prepaid expenses and other current assets Total current assets Property and equipment, net Intangible assets, net Goodwill Other assets Total assets. Liabilities and stockholders' equity Current liabilities: Accounts payable Accrued and other current liabilities. Capital leases, short-term. Total current liabilities Convertible notes Capital leases, long-term Deferred and other long-term tax liabilities, net Other long-term liabilities Total abilities Commitments and contingencies (Note 14) Stockholders' equity: Preferred stock. $0.000006 par value-- 200,000 shares authorized: none issued and outstanding Common stock. $0.000005 par value-5,000,000 shares authorized: 746,902 and 721,572 shares issued and outstanding as of December 31, 2017 and December 31, 2016, respectively.... Additional paid in capital Accumulated other comprehensive loss. Accumulated deficit.. Total stockholders' equity Total liabilities and stockholders' equity 170,969 327,333 84,976 583,278 1,627,460 81,308 13,240 59.973 2.385.259 122.236 380.937 80.848 584,021 1,538,967 66.837 7.556 68.049 2.265.430 4 7,750,522 (31,579) (2.671.729 5,047 218 7,412,477 4 7,224,534 (69.253) (2.550.350) 4,604,935 6,870 365