. After you have studied Economics in the News on pp. 368369, answer the following questions:
a. What are the marginal private costs of and marginal private benefits from using carbon-free resources to generate electricity?
b. What are the marginal social costs of and marginal social benefits from using carbon-free resources to generate electricity?
c. How will a cap-and-trade scheme change the price that households pay for electricity?
d. How will a cap-and-trade scheme change the efficiency of electricity production?

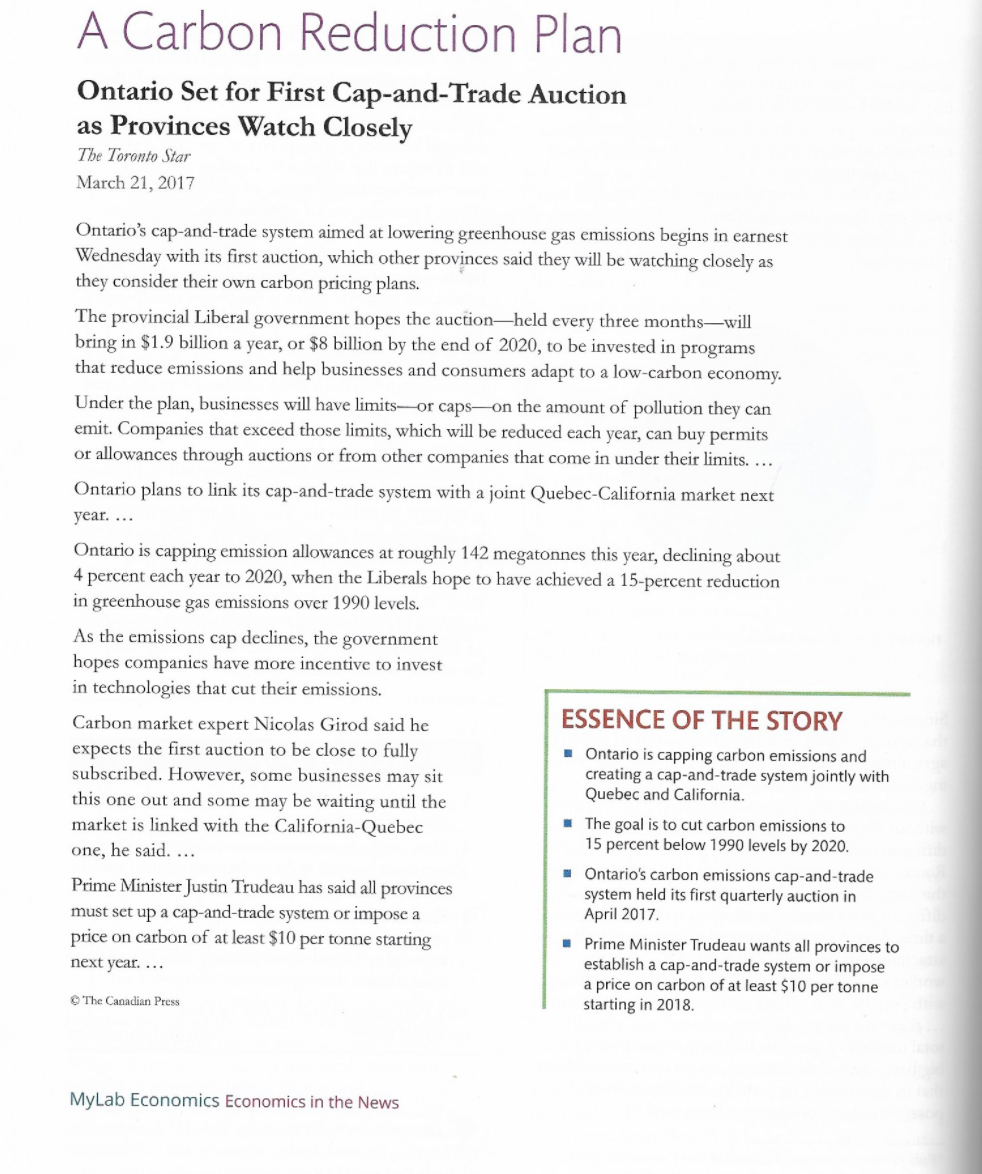
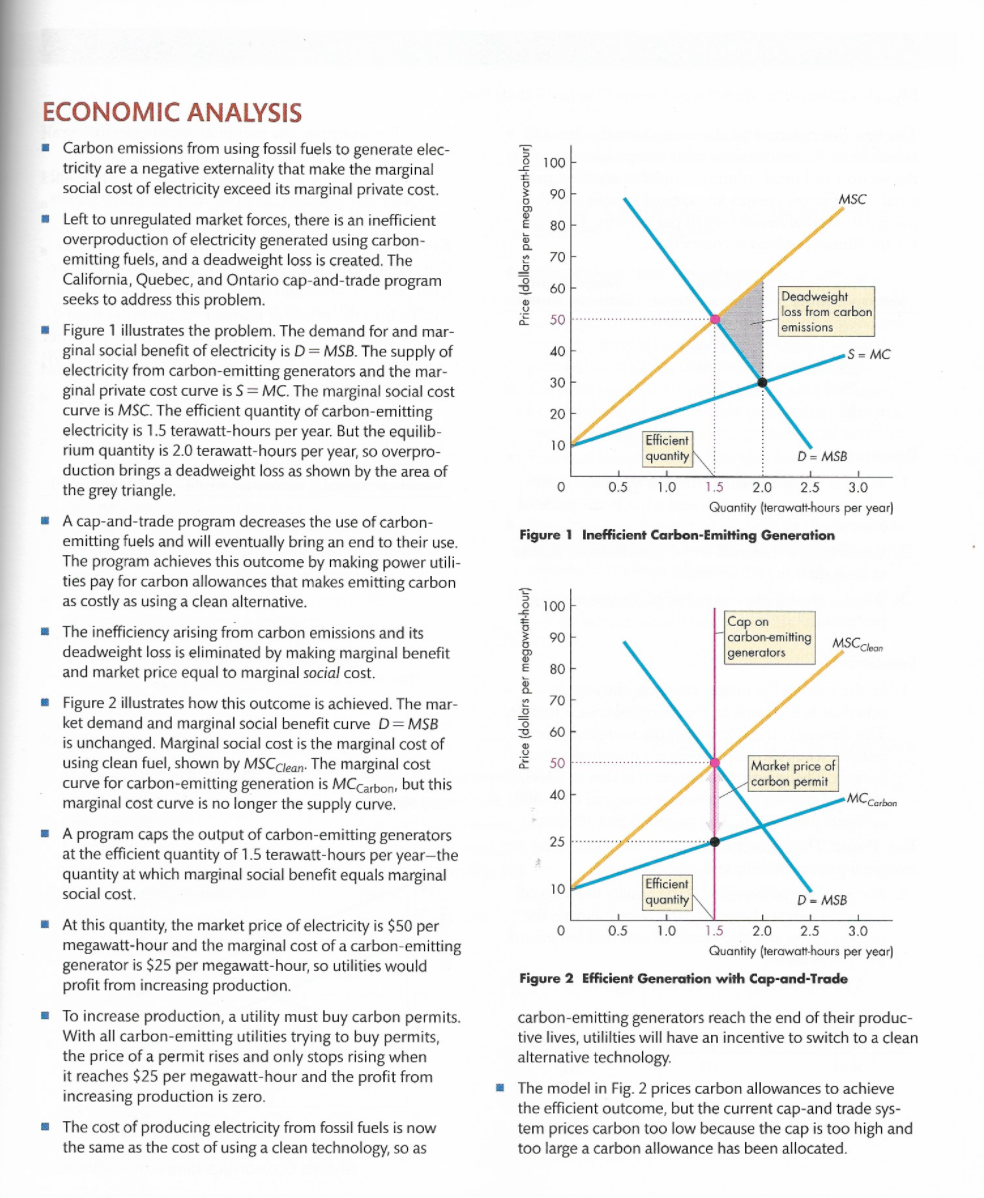
A Carbon Reduction Plan Ontario Set for First Cap-and-Trade Auction as Provinces Watch Closely The Toronto Star March 21, 2017 Ontario's cap-and-trade system aimed at lowering greenhouse gas emissions begins in earnest Wednesday with its first auction, which other provinces said they will be watching closely as they consider their own carbon pricing plans. The provincial Liberal government hopes the auctionheld every three monthswill bring in $1.9 billion a year, or $8 billion by the end of 2020, to be invested in programs that reduce emissions and help businesses and consumers adapt to a low-carbon economy. Under the plan, businesses will have limits--or caps on the amount of pollution they can emit. Companies that exceed those limits, which will be reduced each year, can buy permits or allowances through auctions or from other companies that come in under their limits. ... Ontario plans to link its cap-and-trade system with a joint Quebec-California market next year. ... Ontario is capping emission allowances at roughly 142 megatonnes this year, declining about 4 percent each year to 2020, when the Liberals hope to have achieved a 15-percent reduction in greenhouse gas emissions over 1990 levels. As the emissions cap declines, the government hopes companies have more incentive to invest in technologies that cut their emissions. Carbon market expert Nicolas Girod said he ESSENCE OF THE STORY expects the first auction to be close to fully Ontario is capping carbon emissions and subscribed. However, some businesses may sit creating a cap-and-trade system jointly with this one out and some may be waiting until the Quebec and California. market is linked with the California-Quebec The goal is to cut carbon emissions to 15 percent below 1990 levels by 2020. one, he said. ... Ontario's carbon emissions cap-and-trade Prime Minister Justin Trudeau has said all provinces system held its first quarterly auction in must set up a cap-and-trade system or impose a April 2017 price on carbon of at least $10 per tonne starting Prime Minister Trudeau wants all provinces to next year. ... establish a cap-and-trade system or impose a price on carbon of at least $10 per tonne The Canadian Press starting in 2018 MyLab Economics Economics in the News 100 90 MSC 80 Price (dollars per megawatt-hour) 70 60 Deadweight loss from carbon emissions 50 40 S = MC 30 20 Efficient 10 quantity D = MSB 1 0 0.5 1.0 1.5 2.0 2.5 3.0 Quantity (terawatt-hours per year) Figure 1 Inefficient Carbon-Emitting Generation 100 ECONOMIC ANALYSIS Carbon emissions from using fossil fuels to generate elec- tricity are a negative externality that make the marginal social cost of electricity exceed its marginal private cost. Left to unregulated market forces, there is an inefficient overproduction of electricity generated using carbon- emitting fuels, and a deadweight loss is created. The California, Quebec, and Ontario cap-and-trade program seeks to address this problem. Figure 1 illustrates the problem. The demand for and mar- ginal social benefit of electricity is D= MSB. The supply of electricity from carbon-emitting generators and the mar- ginal private cost curve is S = MC. The marginal social cost curve is MSC. The efficient quantity of carbon-emitting electricity is 1.5 terawatt-hours per year. But the equilib- rium quantity is 2.0 terawatt-hours per year, so overpro- duction brings a deadweight loss as shown by the area of the grey triangle. A cap-and-trade program decreases the use of carbon- emitting fuels and will eventually bring an end to their use. The program achieves this outcome by making power utili- ties pay for carbon allowances that makes emitting carbon as costly as using a clean alternative. The inefficiency arising from carbon emissions and its deadweight loss is eliminated by making marginal benefit and market price equal to marginal social cost. Figure 2 illustrates how this outcome is achieved. The mar- ket demand and marginal social benefit curve D=MSB is unchanged. Marginal social cost is the marginal cost of using clean fuel, shown by MSC Clean. The marginal cost curve for carbon-emitting generation is MC Carbon, but this marginal cost curve is no longer the supply curve. A program caps the output of carbon-emitting generators at the efficient quantity of 1.5 terawatt-hours per year-the quantity at which marginal social benefit equals marginal social cost. At this quantity, the market price of electricity is $50 per megawatt-hour and the marginal cost of a carbon-emitting generator is $25 per megawatt-hour, so utilities would profit from increasing production. To increase production, a utility must buy carbon permits. With all carbon-emitting utilities trying to buy permits, the price of a permit rises and only stops rising when it reaches $25 per megawatt-hour and the profit from increasing production is zero. The cost of producing electricity from fossil fuels is now the same as the cost of using a clean technology, so as Cap on 90 carbonemilting MSC Clean generators 80 Price (dollars per megawatt-hour) 70 60 50 Market price of carbon permit 40 MC Carbon 25 10 Efficient quantity D- MSB 1 0 0.5 1.0 1.5 2.0 2.5 3.0 Quantity (terawatt-hours per year) Figure 2 Efficient Generation with Cap-and-Trade carbon-emitting generators reach the end of their produc- tive lives, utilities will have an incentive to switch to a clean alternative technology The model in Fig. 2 prices carbon allowances to achieve the efficient outcome, but the current cap-and trade sys- tem prices carbon too low because the cap is too high and too large a carbon allowance has been allocated


