Answered step by step
Verified Expert Solution
Question
1 Approved Answer
Ages Number of students 15-18 8 19-22 4 23-26 4 27-30 3 31-34 3 35-38 9 Based on the frequency distribution above, find the relative
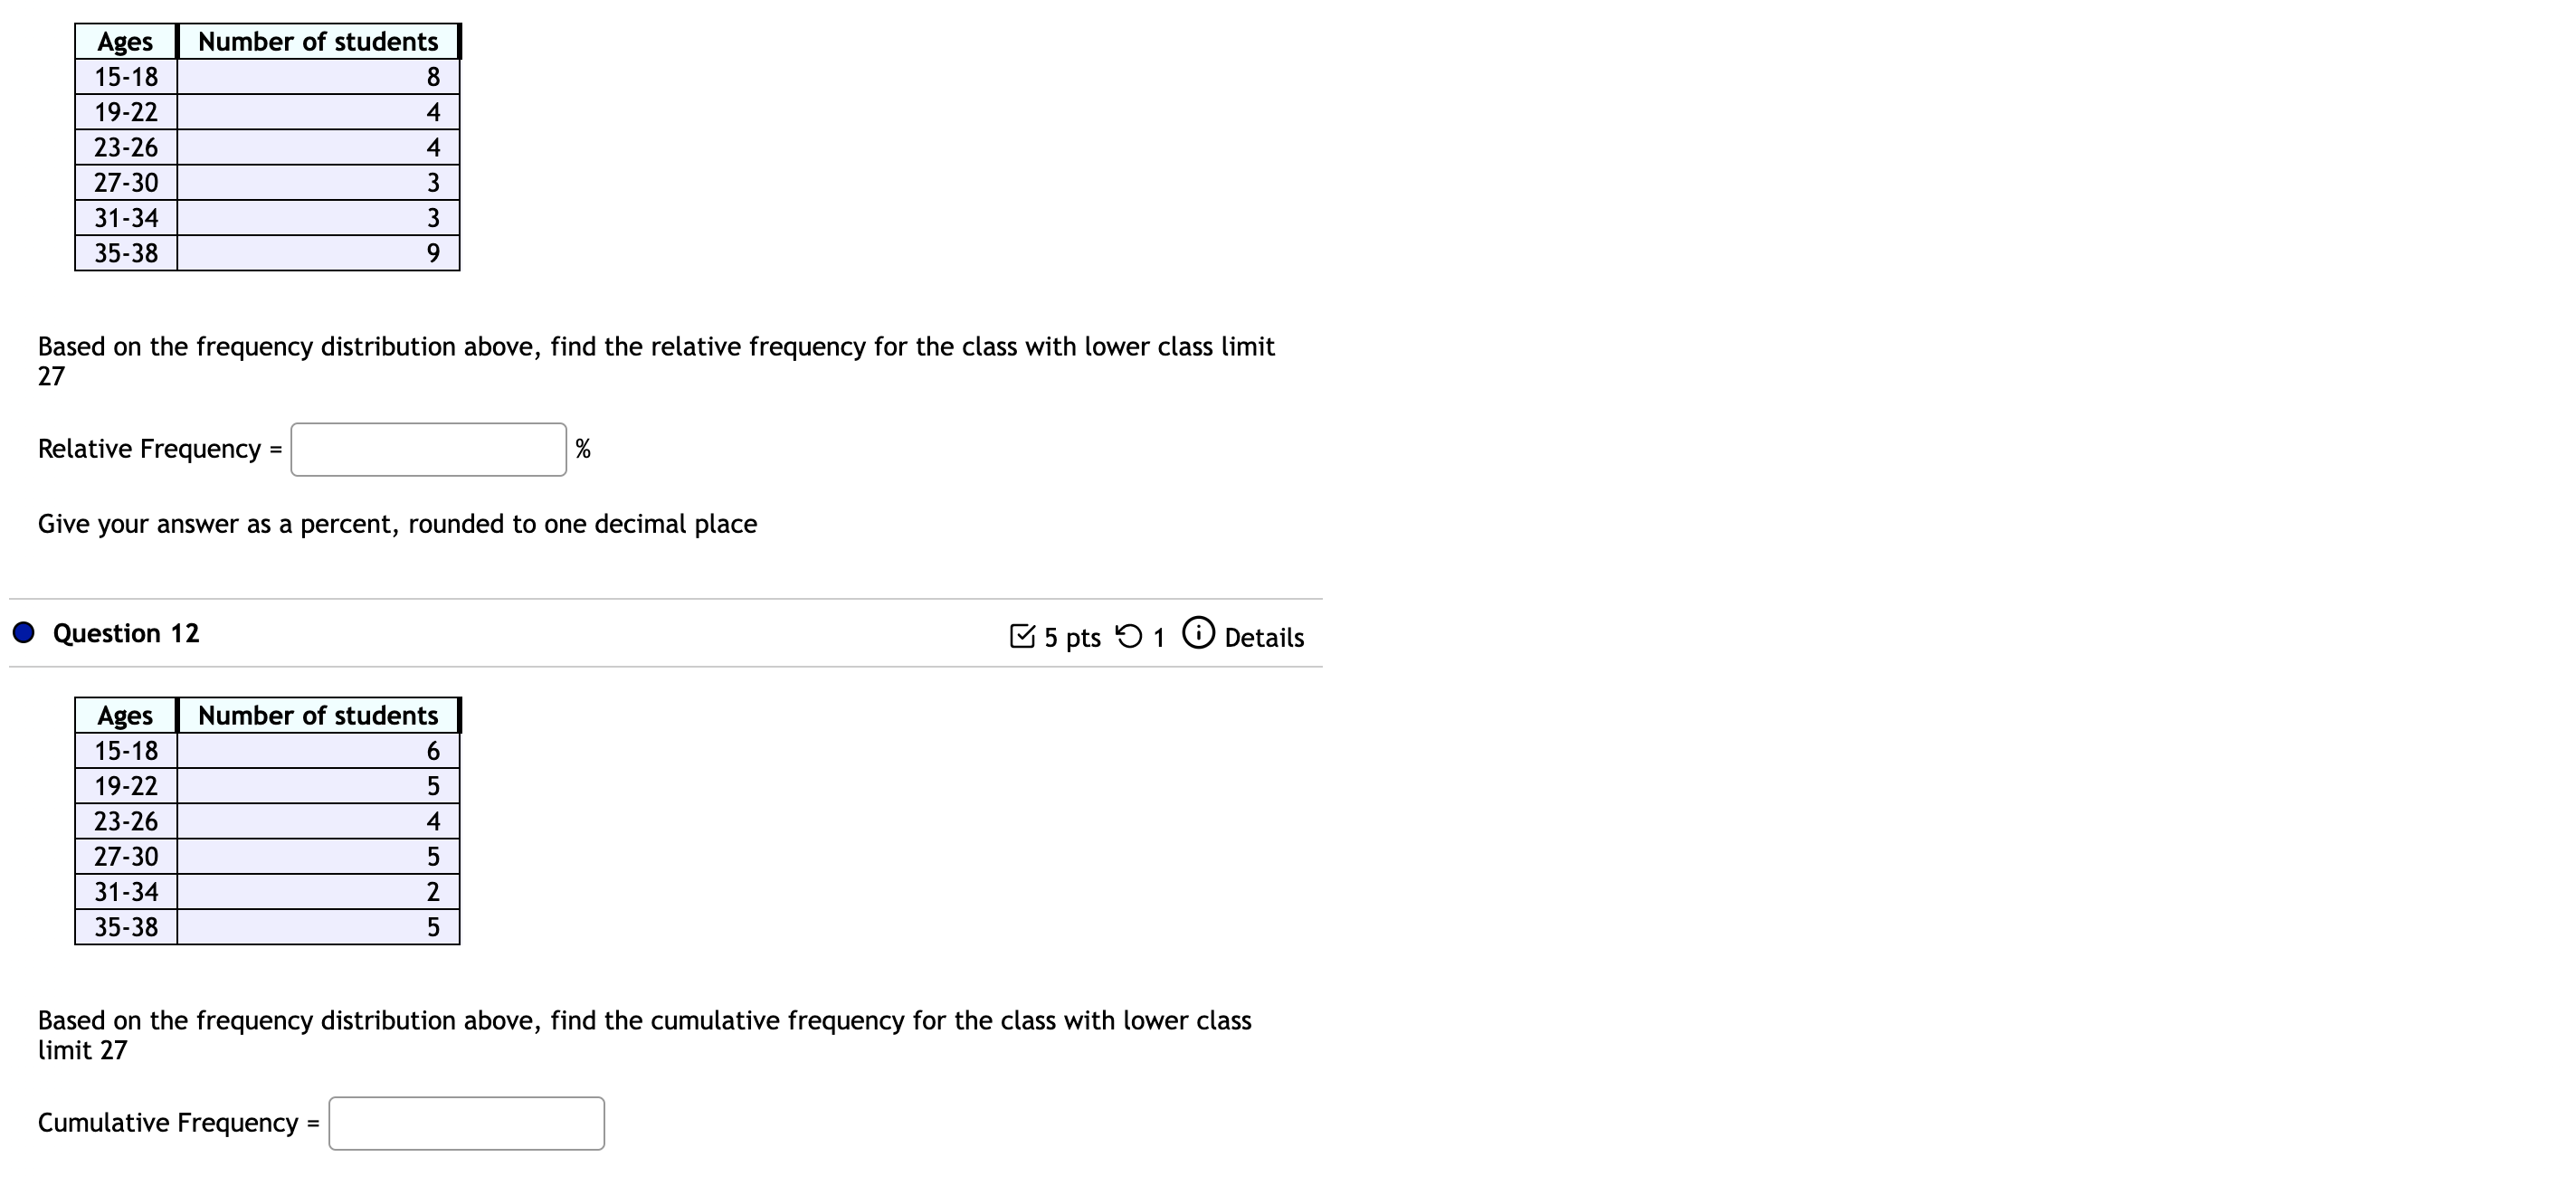
Ages Number of students 15-18 8 19-22 4 23-26 4 27-30 3 31-34 3 35-38 9 Based on the frequency distribution above, find the relative frequency for the class with lower class limit 27 Relative Frequency = % Give your answer as a percent, rounded to one decimal place Question 12 5 pts 9 1 0 Details Ages Number of students 15-18 6 19-22 5 23-26 4 27-30 5 31-34 2 35-38 5 Based on the frequency distribution above, find the cumulative frequency for the class with lower class limit 27 Cumulative Frequency =Frequency 7 13 19 25 31 37 data Based on the histogram above, what is the frequency of the class containing the value 8 0 Question 14 C4 5 pts '0 1 (D Details Data was collected for a sample of organic snacks. The amount of sugar (in mg) in each snack is summarized in the histogram below. Frequency 100 120 I40 I60 180 200 220 240 amount 0f xugar (mg) What is the sample size for this data set? n: Giving a test to a group of students, the grades and gender are summarized below A B C Total Male 6 3 16 25 Female 9 2 17 28 Total 15 5 33 53 Let Y be the event that the student got a "B" If one student is chosen at random, find P07). Hint Remember, the notation )7 is the 'complement' of event Y. So to find P07), you are finding the probability that event Y did NOT happen. m7) =
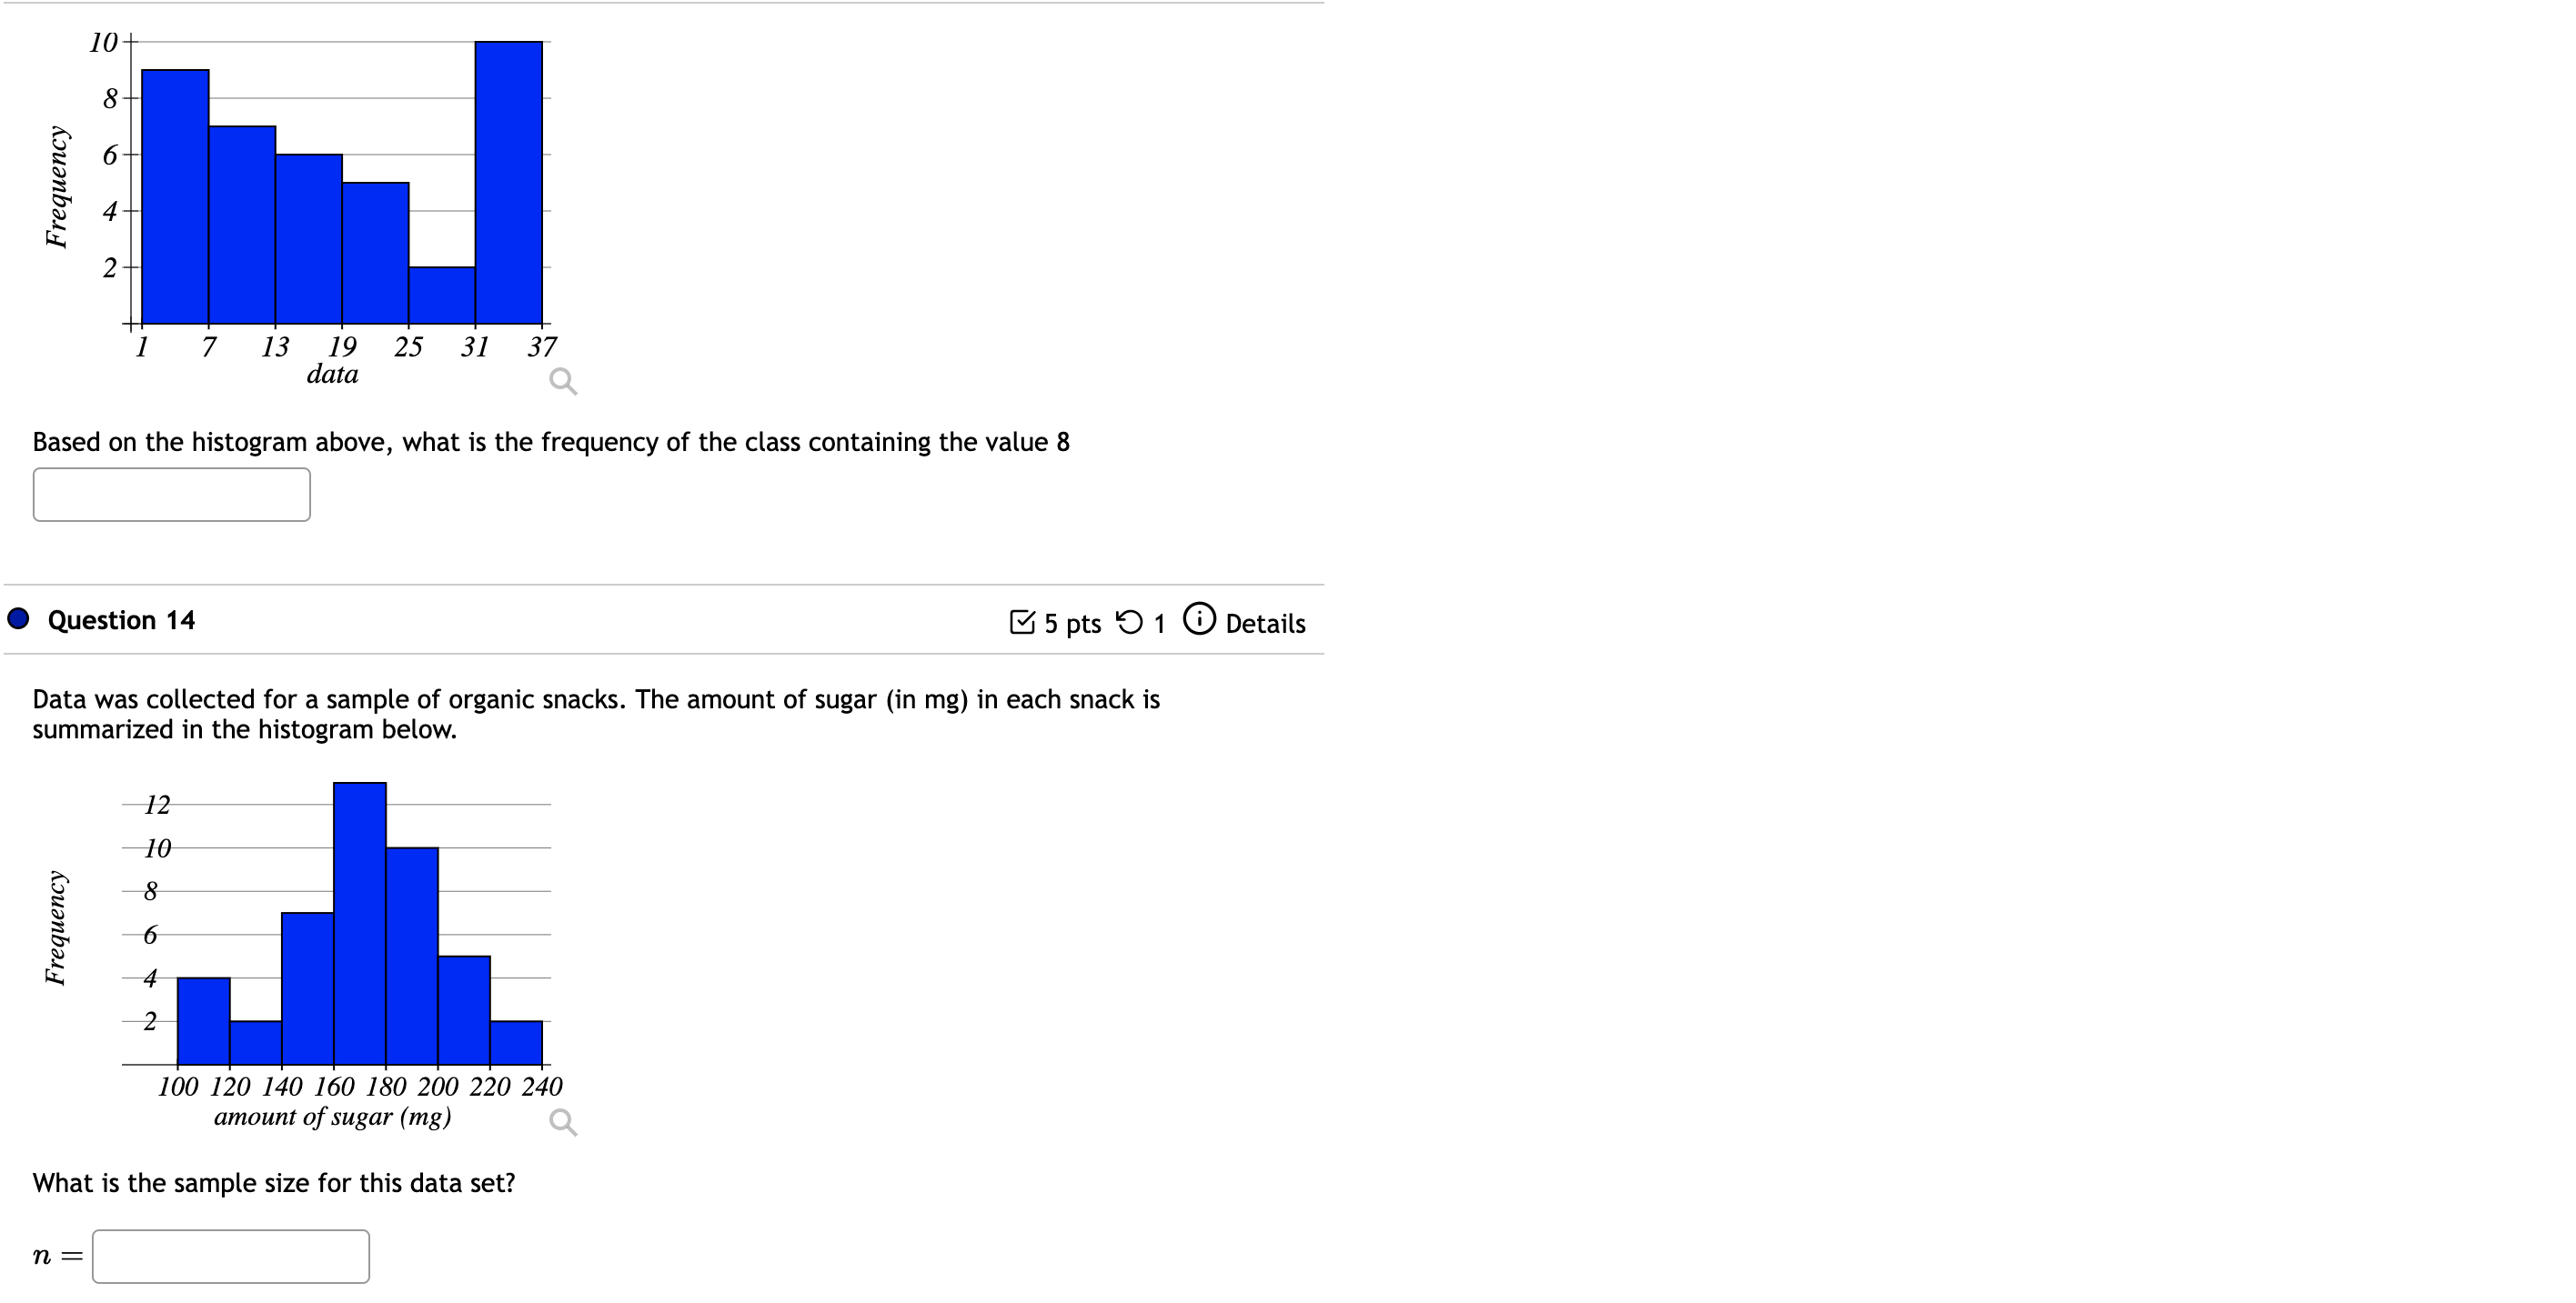
Step by Step Solution
There are 3 Steps involved in it
Step: 1
Get Instant Access to Expert-Tailored Solutions
See step-by-step solutions with expert insights and AI powered tools for academic success
Step: 2
Step: 3
Ace Your Homework with AI
Get the answers you need in no time with our AI-driven, step-by-step assistance
Get Started