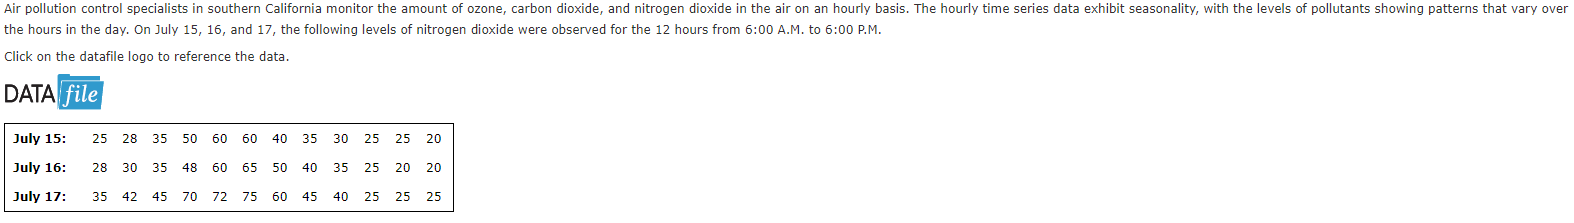
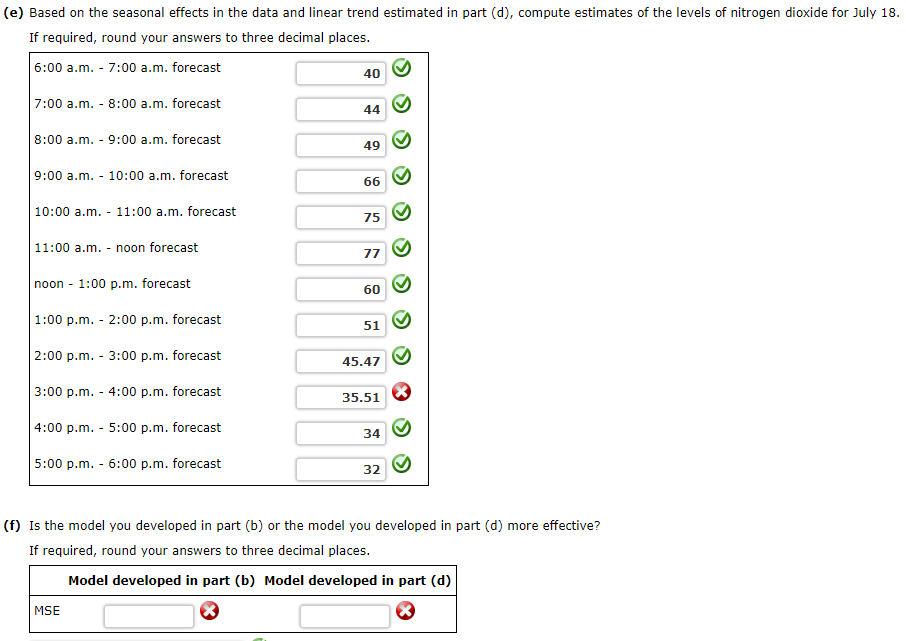
Air pollution control specialists in southern California monitor the amount of ozone, carbon dioxide, and nitrogen dioxide in the air on an hourly basis. The hourly time series data exhibit seasonality, with the levels of pollutants showing patterns that vary over the hours in the day. On July 15, 16, and 17, the following levels of nitrogen dioxide were observed for the 12 hours from 6:00 A.M. to 6:00 P.M. Click on the datafile logo to reference the data. DATA file July 15: 25 28 35 50 60 60 40 35 30 25 25 20 July 16: 28 30 35 48 60 65 50 40 35 25 20 20 July 17: 35 42 45 70 72 75 60 45 40 25 25 25 (e) Based on the seasonal effects in the data and linear trend estimated in part (d), compute estimates of the levels of nitrogen dioxide for July 18. If required, round your answers to three decimal places. 6:00 a.m. - 7:00 a.m. forecast 40 7:00 a.m. - 8:00 a.m. forecast 44 8:00 a.m. - 9:00 a.m. forecast 49 9:00 a.m. - 10:00 a.m. forecast 66 10:00 a.m. - 11:00 a.m. forecast 75 11:00 a.m. - noon forecast 77 noon - 1:00 p.m. forecast 60 1:00p.m. - 2:00 p.m. forecast 51 2:00 p.m. - 3:00 p.m. forecast y 45.47 3:00 p.m. - 4:00 p.m. forecast 35.51 4:00 p.m. - 5:00 p.m. forecast 34 5:00 p.m. - 6:00 p.m. forecast 32 (f) Is the model you developed in part (b) or the model you developed in part (d) more effective? If required, round your answers to three decimal places. Model developed in part (b) Model developed in part (d) * MSE Air pollution control specialists in southern California monitor the amount of ozone, carbon dioxide, and nitrogen dioxide in the air on an hourly basis. The hourly time series data exhibit seasonality, with the levels of pollutants showing patterns that vary over the hours in the day. On July 15, 16, and 17, the following levels of nitrogen dioxide were observed for the 12 hours from 6:00 A.M. to 6:00 P.M. Click on the datafile logo to reference the data. DATA file July 15: 25 28 35 50 60 60 40 35 30 25 25 20 July 16: 28 30 35 48 60 65 50 40 35 25 20 20 July 17: 35 42 45 70 72 75 60 45 40 25 25 25 (e) Based on the seasonal effects in the data and linear trend estimated in part (d), compute estimates of the levels of nitrogen dioxide for July 18. If required, round your answers to three decimal places. 6:00 a.m. - 7:00 a.m. forecast 40 7:00 a.m. - 8:00 a.m. forecast 44 8:00 a.m. - 9:00 a.m. forecast 49 9:00 a.m. - 10:00 a.m. forecast 66 10:00 a.m. - 11:00 a.m. forecast 75 11:00 a.m. - noon forecast 77 noon - 1:00 p.m. forecast 60 1:00p.m. - 2:00 p.m. forecast 51 2:00 p.m. - 3:00 p.m. forecast y 45.47 3:00 p.m. - 4:00 p.m. forecast 35.51 4:00 p.m. - 5:00 p.m. forecast 34 5:00 p.m. - 6:00 p.m. forecast 32 (f) Is the model you developed in part (b) or the model you developed in part (d) more effective? If required, round your answers to three decimal places. Model developed in part (b) Model developed in part (d) * MSE