Al Ain University
College of Business
Statistics for Decision Making
Dr. Shorouq Fathi Eletter
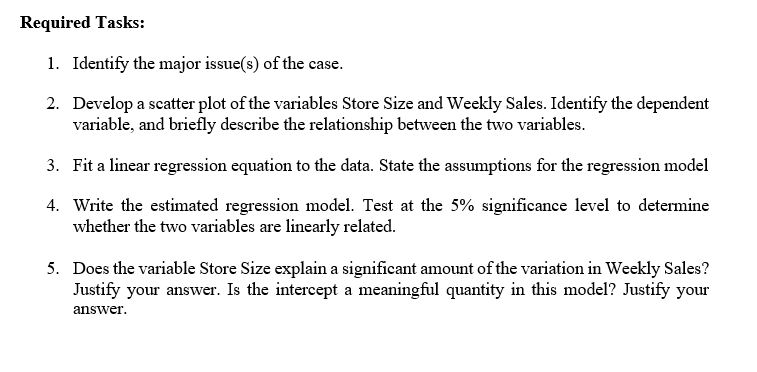
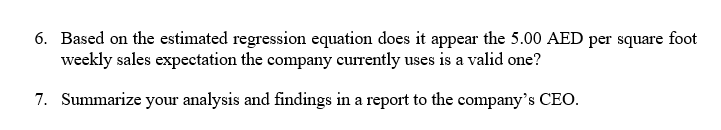
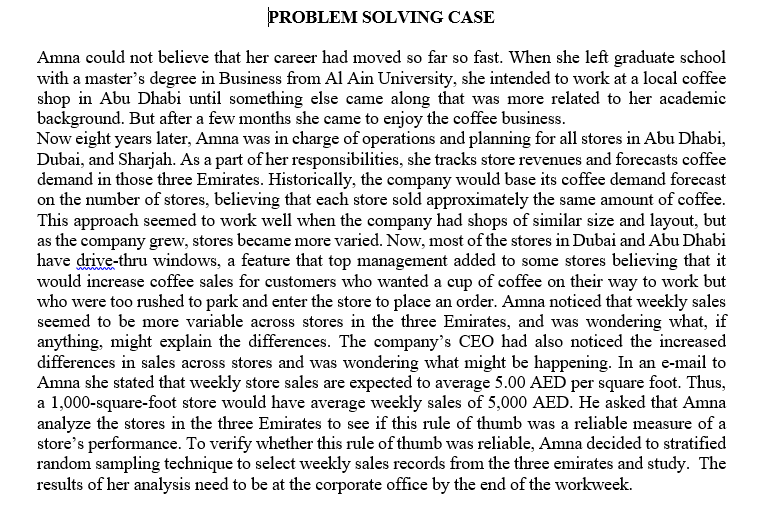
Required Tasks: 1. Identify the major issue(s) of the case. 2. Develop a scatter plot of the variables Store Size and Weekly Sales. Identify the dependent variable, and briefly describe the relationship between the two variables. 3. Fit a linear regression equation to the data. State the assumptions for the regression model 4. Write the estimated regression model. Test at the 5% significance level to determine whether the two variables are linearly related. 5. Does the variable Store Size explain a significant amount of the variation in Weekly Sales? Justify your answer. Is the intercept a meaningful quantity in this model? Justify your answer.6. Based on the estimated regression equation does it appear the 5.00 AED per square foot weekly sales expectation the company currently uses is a valid one? 7. Summarize your analysis and findings in a report to the company's CEO.iPRDBLEM SDLWG CASE Amna could not believe that her career had moved so far so fast. When she left: graduate school with a master's degree in Business om Al Ain University, she intended to work at a local coffee shop in Abu Dhabi until something else came along that was more related to her academic background. But after a few months she came to enjoy the coffee business. New eight years later, Amna was in charge of operations and planning for all stores in Abu Dhabi, Dubai, and Shari ah. As a part of her responsibilities, she tracks store revenues and forecasts coffee demand inthose three Emirates. Historically, the company would base its mee demand forecast on the munber of stores, believing that each store sold approximately the same amount of coffee. This approach seemed to work well when the company had shops of similar size and layout, but as the company grew, stores becarue more varied. Now, most of the stores in Dubai and Abu Dhabi have mm windows, a feature that top management added to some stores believing that it would increase coffee sales for customers who wanted a cup of coffee on their way to work but who were too rushed to park and enter the store to place an order. Amna noticed that weekly sales seemed to he more variable across stores in the three Emirates, and was wondering what, if anything, might explain the dierences. The company s CED had also noticed the increased differences m sales across stores and was wondering what might be happening. In an e-mail to Amna she stated that weekly store sales are expected to average i AED per square foot. Thus, a 1,D-square-foot store would have average weekly sales of 5,[} AED. He asked that Amna analyze the stores in the three Emirates to see if this rule of thumb was a reliable measure of a store's performance. To verify whether this rule of thumb was reliable, Amna decided to stratied random sampling technique to select weekly sales records from the three emirates and study. The results of her analysis need to be at the corporate ofce by the end of the workweek