ALL ABOUT BIO STATISTICS
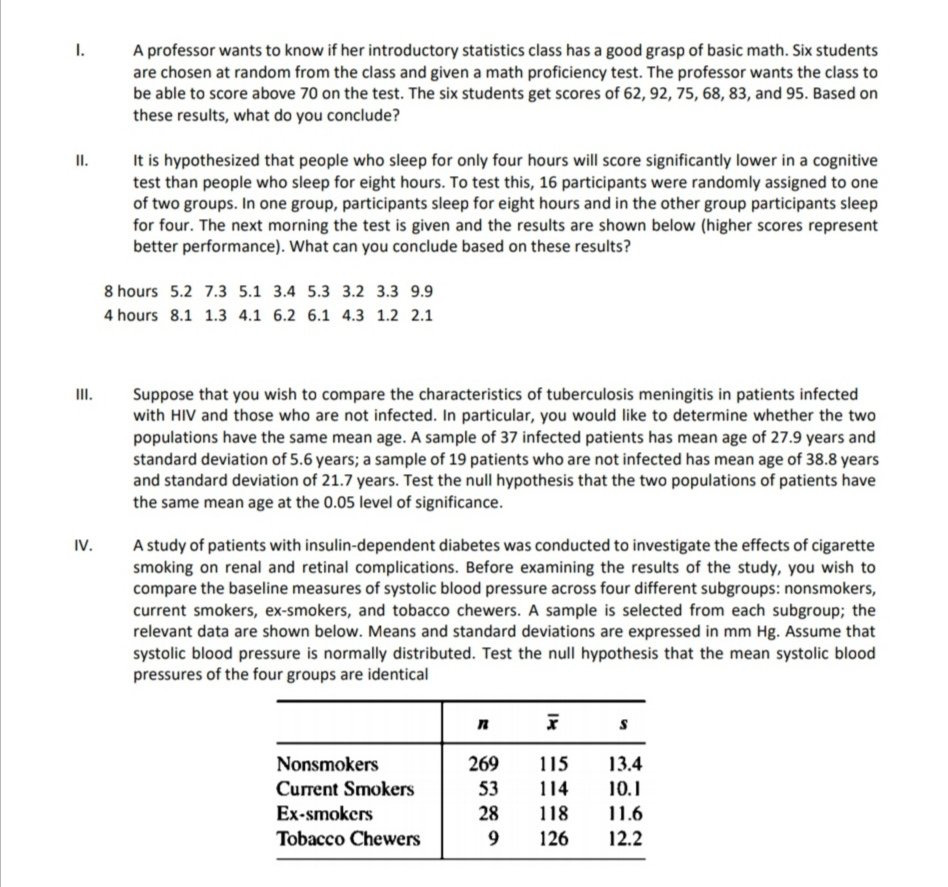
1. A professor wants to know if her introductory statistics class has a good grasp of basic math. Six students are chosen at random from the class and given a math proficiency test. The professor wants the class to be able to score above 70 on the test. The six students get scores of 62, 92, 75, 68, 83, and 95. Based on these results, what do you conclude? 11. It is hypothesized that people who sleep for only four hours will score significantly lower in a cognitive test than people who sleep for eight hours. To test this, 16 participants were randomly assigned to one of two groups. In one group, participants sleep for eight hours and in the other group participants sleep for four. The next morning the test is given and the results are shown below (higher scores represent better performance). What can you conclude based on these results? 8 hours 5.2 7.3 5.1 3.4 5.3 3.2 3.3 9.9 4 hours 8.1 1.3 4.1 6.2 6.1 4.3 1.2 2.1 III. Suppose that you wish to compare the characteristics of tuberculosis meningitis in patients infected with HIV and those who are not infected. In particular, you would like to determine whether the two populations have the same mean age. A sample of 37 infected patients has mean age of 27.9 years and standard deviation of 5.6 years; a sample of 19 patients who are not infected has mean age of 38.8 years and standard deviation of 21.7 years. Test the null hypothesis that the two populations of patients have the same mean age at the 0.05 level of significance. IV. A study of patients with insulin-dependent diabetes was conducted to investigate the effects of cigarette smoking on renal and retinal complications. Before examining the results of the study, you wish to compare the baseline measures of systolic blood pressure across four different subgroups: nonsmokers, current smokers, ex-smokers, and tobacco chewers. A sample is selected from each subgroup; the relevant data are shown below. Means and standard deviations are expressed in mm Hg. Assume that systolic blood pressure is normally distributed. Test the null hypothesis that the mean systolic blood pressures of the four groups are identical Nonsmokers 269 115 13.4 Current Smokers 53 114 10.1 Ex-smokers 28 118 11.6 Tobacco Chewers 9 126 12.2


