All Data Tally Frequency children (0 - 19) young adults (20 - 39) adults (40 - 59) seniors (60 +) 5 Number Summary Minimum Q1
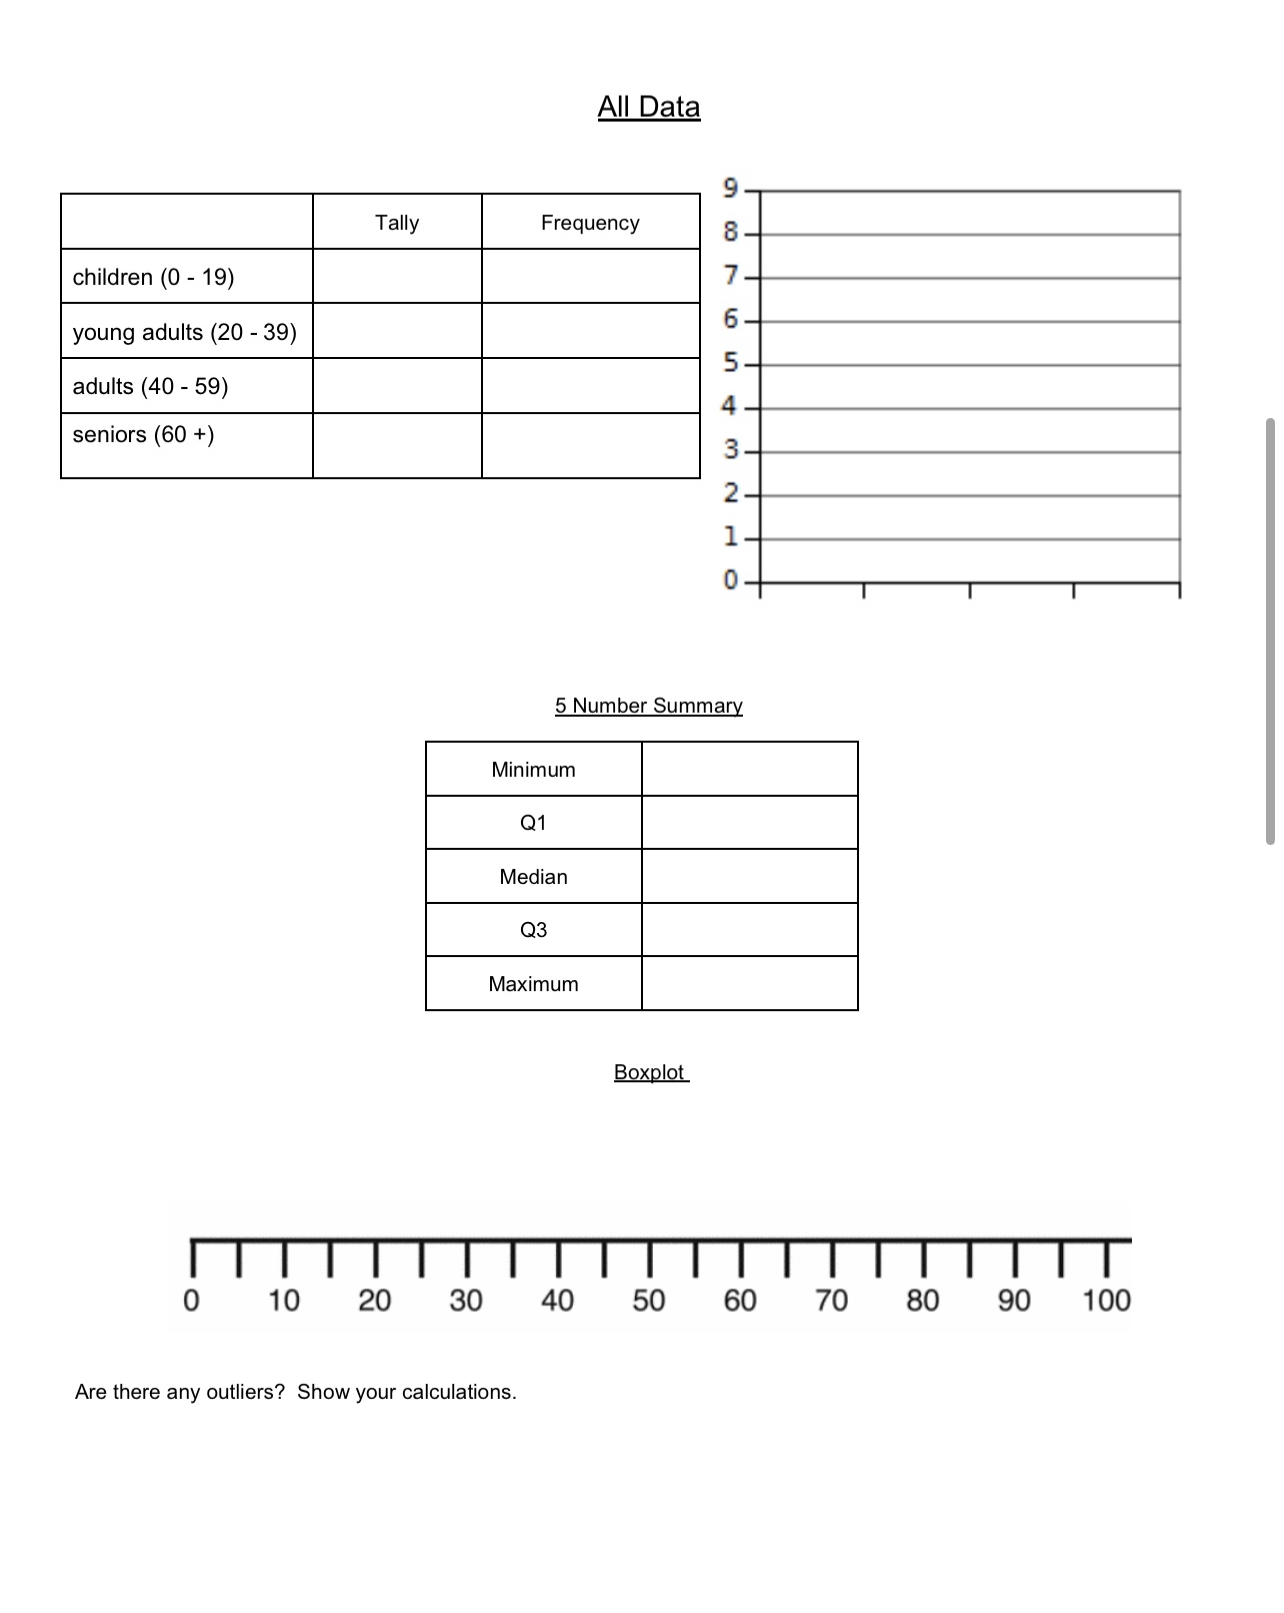
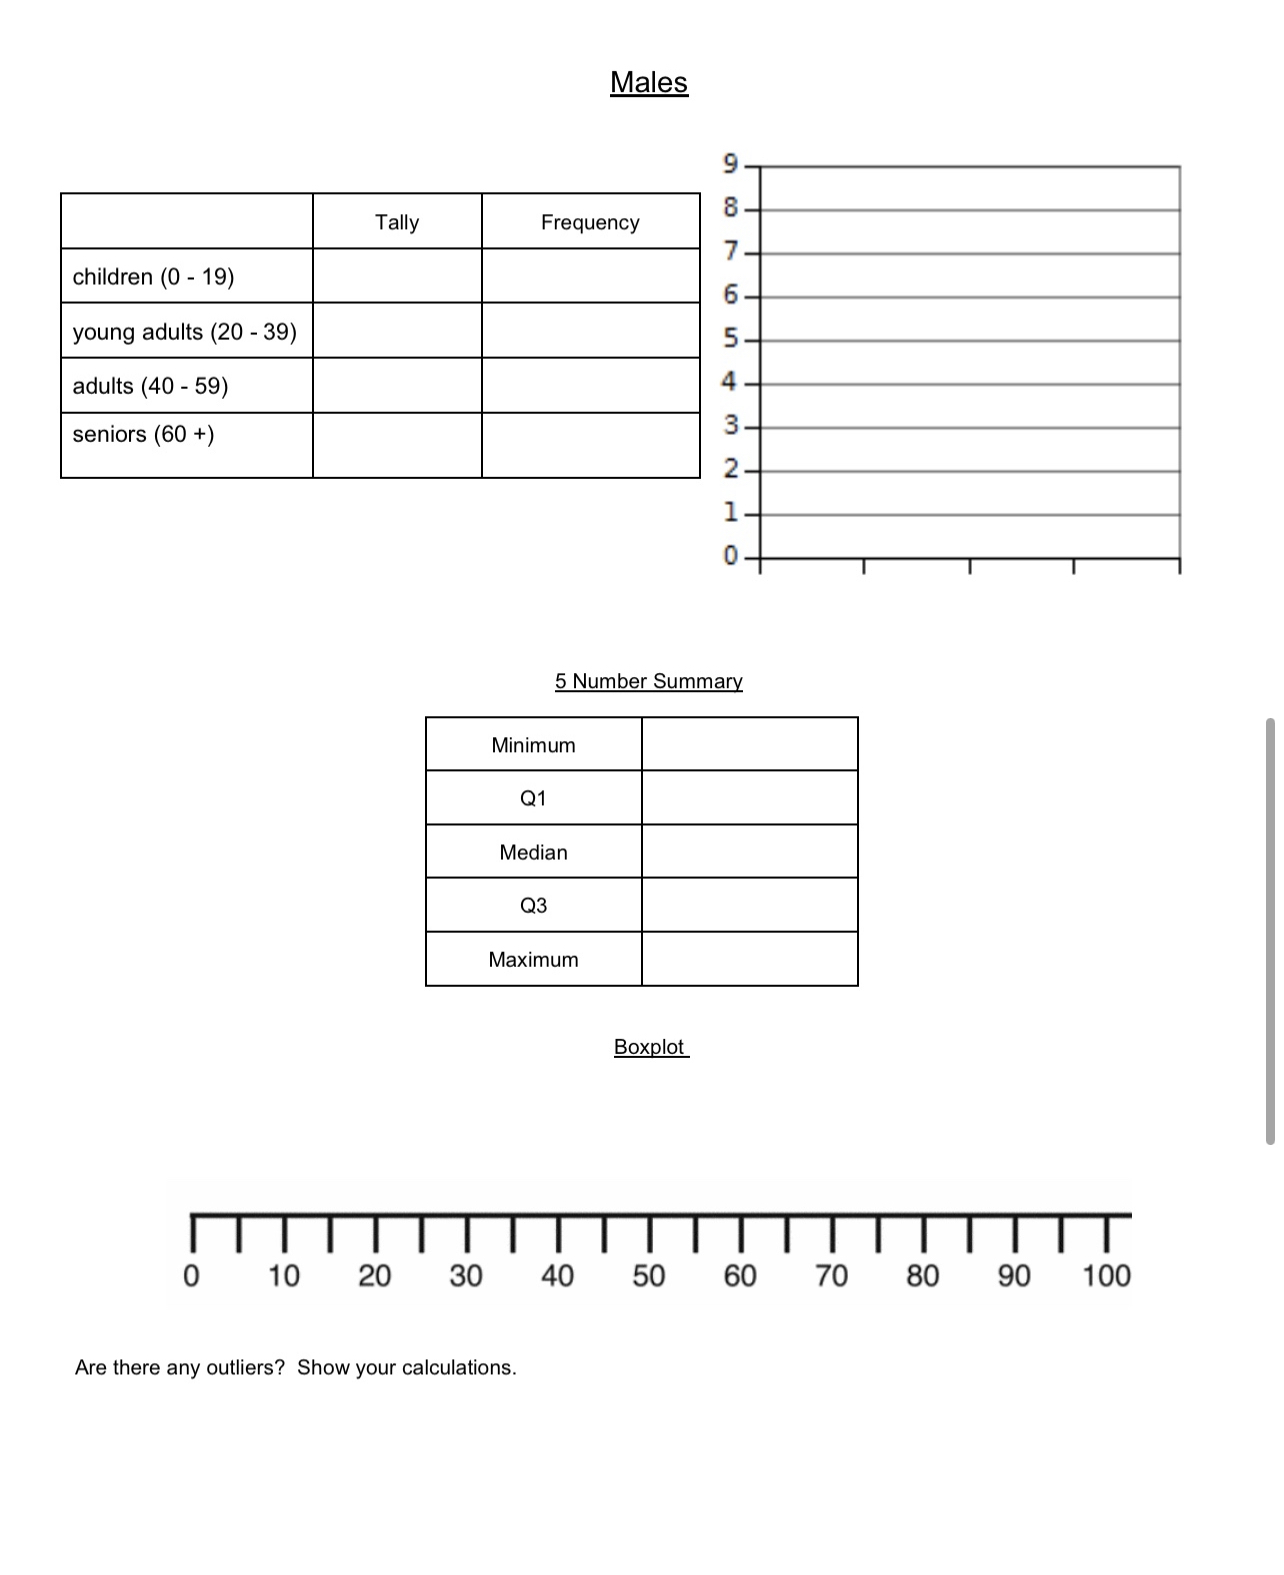
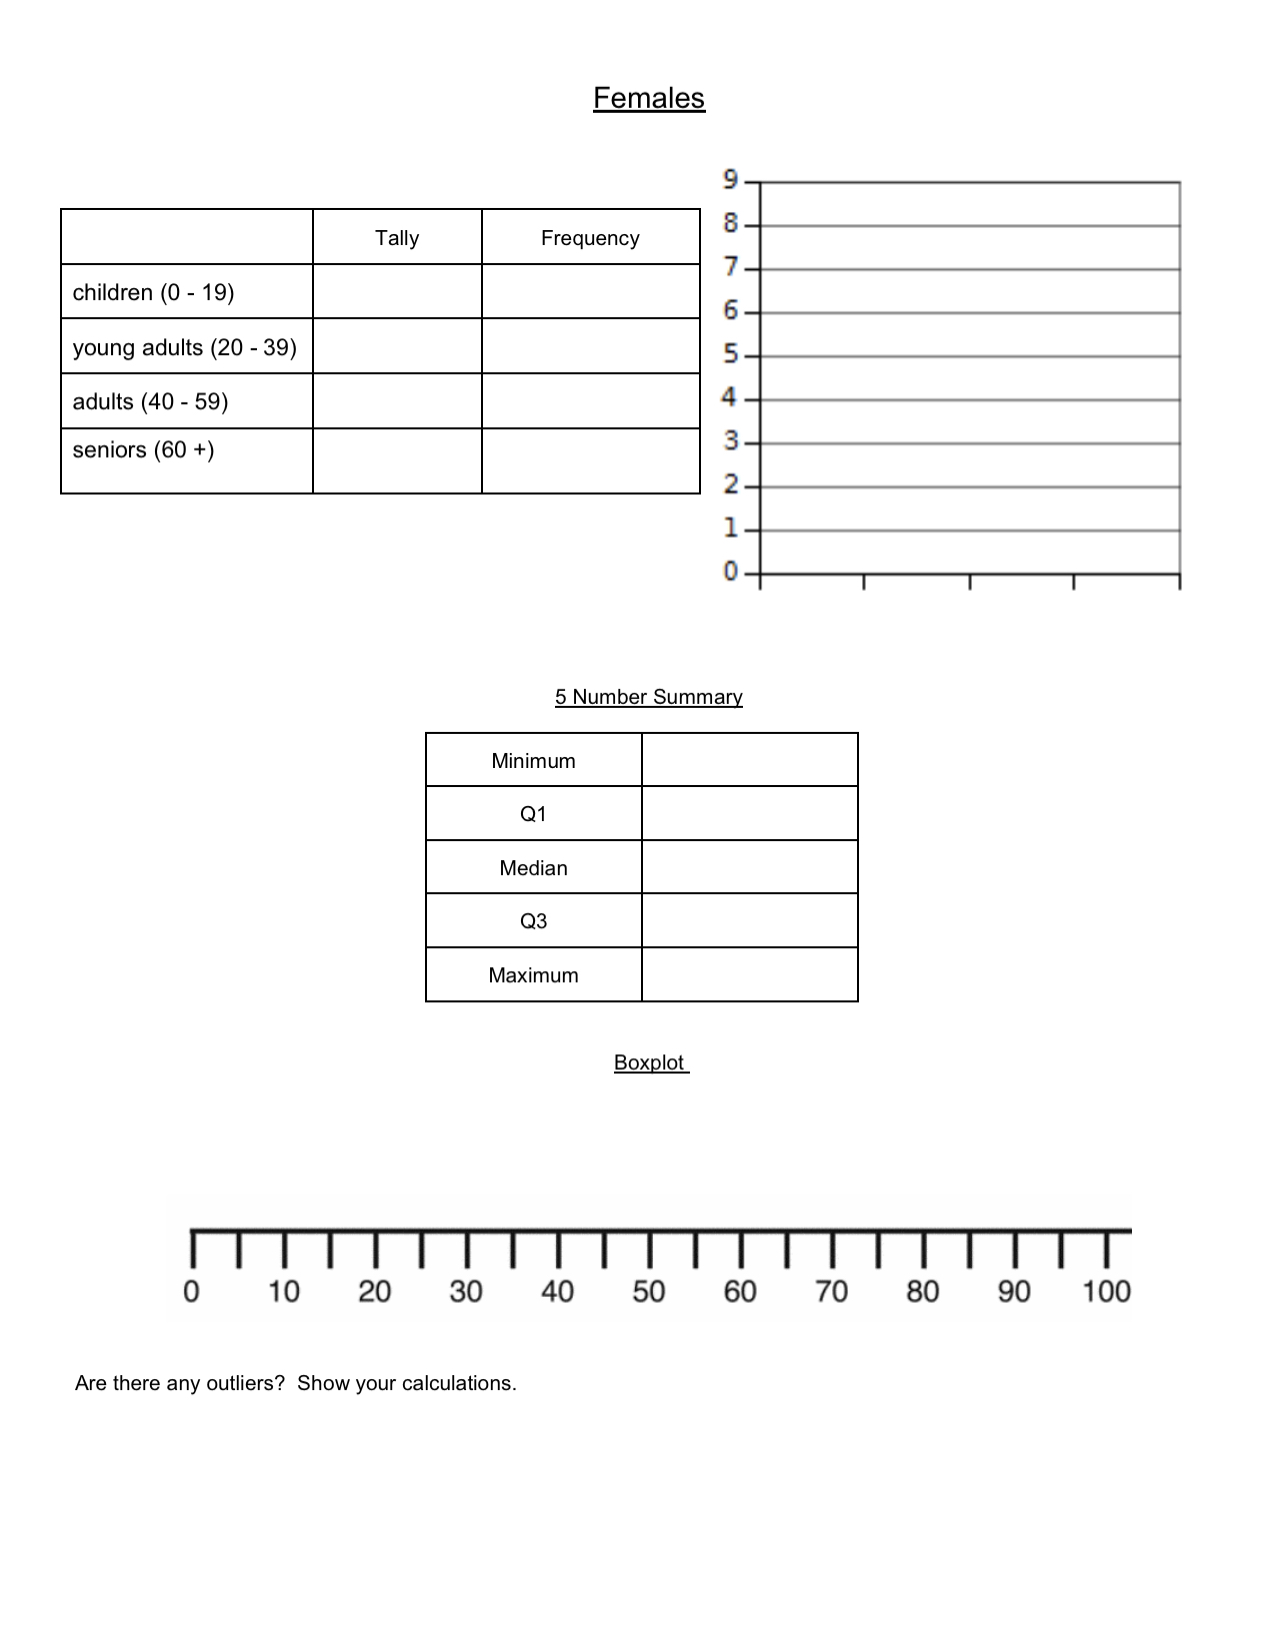
All Data Tally Frequency children (0 - 19) young adults (20 - 39) adults (40 - 59) seniors (60 +) 5 Number Summary Minimum Q1 Median Q3 Maximum Boxplot TITT ITTTTTT 10 20 30 40 50 60 70 80 90 100 Are there any outliers? Show your calculations.Males Tally Frequency children (0 - 19) young adults (20 - 39) adults (40 - 59) seniors (60 +) WO 5 Number Summary Minimum Q1 Median 23 Maximum Boxplot TITT o 10 20 30 40 50 60 70 80 90 100 Are there any outliers? Show your calculations.Females Tally Frequency children (0 - 19) young adults (20 - 39) Un adults (40 - 59) CO seniors (60 +) 5 Number Summary Minimum Q1 Median Q3 Maximum Boxplot ITITTTTT 0 10 20 30 40 50 60 70 80 90 100 Are there any outliers? Show your calculations.Data Table Name Relationship to you Age Self Female 27 2 Mo Male 30 3 D Male 9 Mani Female 3 5 Drees Male 1 6 Mom Female 46 Gloria Female 69 8 Dad Male 49 9 JJ Female 16 10 Trace Male 19 11 Bailey Male 23 12 Tori Female 26 13 Iris Female 23 14 Ahlanie Female 5 15 Len Female 19 16 Samra Female 31 17 Tima Female 26 18 Mike Male 50 19 Ali Female 48 20 Liz Female 26Questions Assume that you put the names of each person in your data collection in a hat. Each question involves selecting a name or names from the hat. 6. What is the probability that you will choose a person In the children or young adult category? 7. What is the probability that you will choose a person NOT In the children or young adult category? B. What Is the probability of you choosing a person from the adult or seniors category? Is this different from your answer in #7? Why or why not? 9. Your family plays a money game for Christmas where the someone pulls names out of a hat. If a child is chosen, they win $10. If a young adult is chosen, they win $50. If an adult is chosen. they have to pay $50 and If a senior is chosen, they have to pay $100. What Is the expected value for your family if the game ls played 5 times? 3. Calculate the mean and standard deviation of the all three groups of data collected and record the Information below. ___ 4. Using ALL data. find the z-score of the 8'\" person on your list. 5. Using ALL data, find the z-score of the youngest OR oldest person on your list. How many standard deviations away from the mean is this person? Is this age unusual compared to the others? n. I' In this project, you are going to graphically present and calculate statistics of a set of data that you gather. In addition, you will use the data to answer various probabilityi'counting questions. The information below will instruct you on how to gather your data and what you will then do with the data. MB. You will gather the ages (in years) of all of your immediate family members (parents, siblings) and extended family members (grandparents, aunts, uncles, cousins). You should gather between 20 to 30 ages. Wan. You will be presenting the data in a number of ways. Use the provided page for each. 1. A table, with all the data present, that shows the individuals, their relationship to you, and age. 2. Three boxplots that show: all the ages in your set of data, all the ages of males and all the ages of females. 3. A histogram that shows the amount of individuals in the age categories below: children (0 - 19); young adults (20 - 39); adults (40 - 59); seniors (60 +)
Step by Step Solution
There are 3 Steps involved in it
Step: 1
Get Instant Access to Expert-Tailored Solutions
See step-by-step solutions with expert insights and AI powered tools for academic success
Step: 2
Step: 3
Ace Your Homework with AI
Get the answers you need in no time with our AI-driven, step-by-step assistance