Answered step by step
Verified Expert Solution
Link Copied!

Question

1 Approved Answer

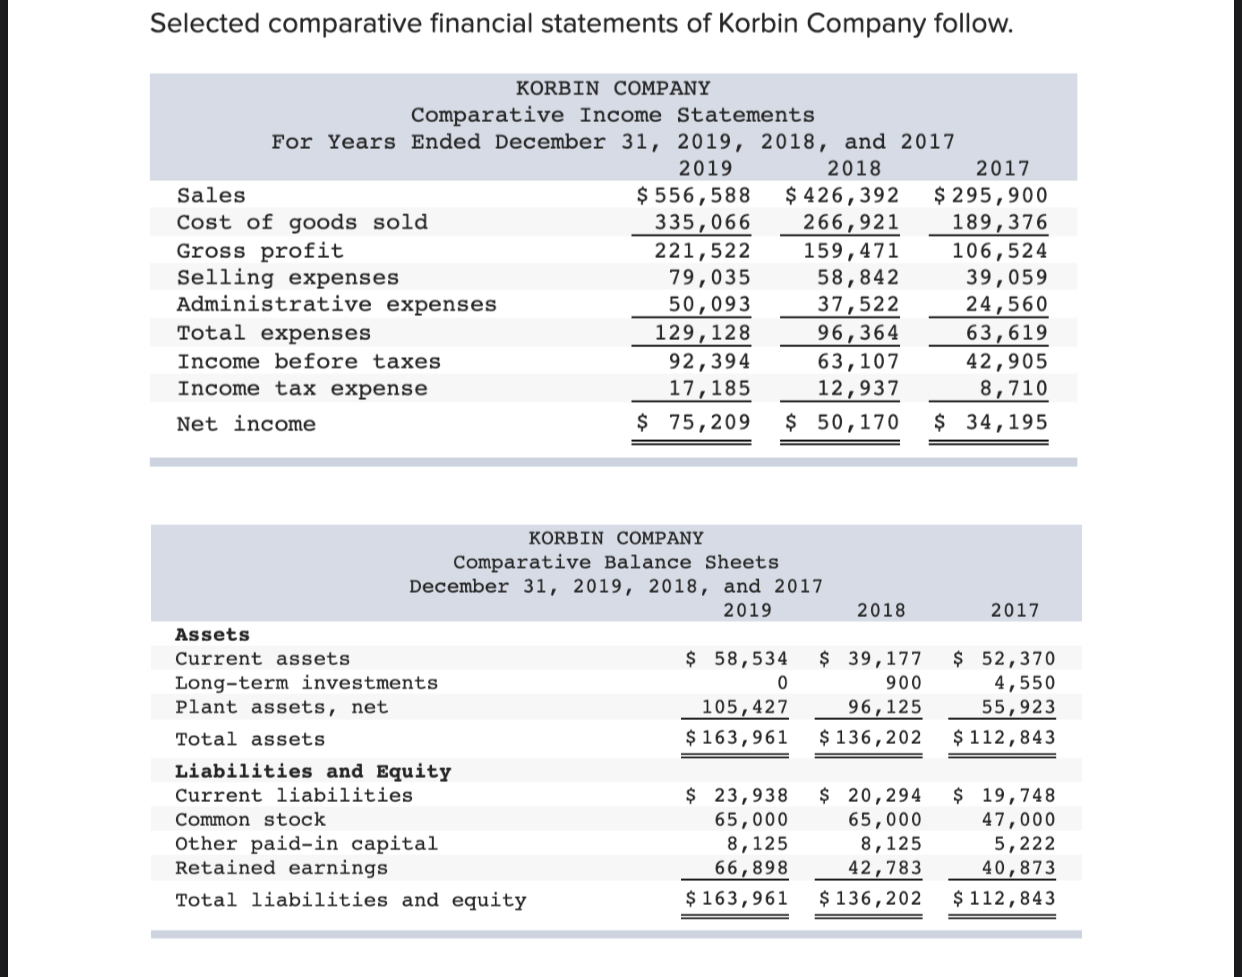
ALL ONE question so please read carefully Selected comparative financial statements of Korbin Company follow. KORBIN COMPANY Comparative Income Statements For Years Ended December 31,

ALL ONE question so please read carefully

image text in transcribedimage text in transcribedimage text in transcribedimage text in transcribedimage text in transcribed

Selected comparative financial statements of Korbin Company follow. KORBIN COMPANY Comparative Income Statements For Years Ended December 31, 2019, 2018, and 2017 2019 2018 2017 Sales $ 556,588 $ 426,392 $ 295,900 Cost of goods sold 335,066 266,921 189, 376 Gross profit 221,522 159,471 106,524 Selling expenses 79,035 58,842 39,059 Administrative expenses 50,093 37,522 24,560 Total expenses 129, 128 96,364 63,619 Income before taxes 92,394 63,107 42,905 Income tax expense 17, 185 12,937 8,710 Net income $ 75,209 $ 50,170 $ 34,195 2017 KORBIN COMPANY Comparative Balance Sheets December 31, 2019, 2018, and 2017 2019 2018 Assets Current assets $ 58,534 $ 39,177 Long-term investments 0 900 Plant assets, net 105,427 96, 125 Total assets $ 163,961 $ 136,202 Liabilities and Equity Current liabilities $ 23,938 $ 20,294 Common stock 65,000 65,000 Other paid-in capital 8,125 8,125 Retained earnings 66,898 42,783 Total liabilities and equity $ 163,961 $ 136,202 $ 52,370 4,550 55,923 $ 112,843 $ 19,748 47,000 5,222 40,873 $ 112,843 Required: 1. Complete the below table to calculate each year's current ratio. Current Ratio Choose Numerator: Current ratio Choose Denominator: Connect / = 2019 Current ratio 0 to 1 0 to 1 2018 - II 2017 1 = O to 1 2. Complete the below table to calculate income statement data in common-size percents. (Round your percentage answers to 2 decimal places.) KORBIN COMPANY Common-Size Comparative Income Statements For Years Ended December 31, 2019, 2018, and 2017 2019 2018 2017 Sales % % % Cost of goods sold Gross profit Selling expenses Administrative expenses Total expenses Income before taxes Income tax expense Net income % % % 3. Complete the below table to calculate the balance sheet data in trend percents with 2017 as base year. (Round your percentage answers to 2 decimal places.) KORBIN COMPANY Balance Sheet Data in Trend Percents December 31, 2019, 2018 and 2017 2019 2018 2017 Assets Current assets % % 100.00 % Long-term investments 100.00 Plant assets, net 100.00 Total assets % % 100.00 % Liabilities and Equity Current liabilities % % 100.00 % Common stock 100.00 Other paid-in capital 100.00 Retained earnings 100.00 Total liabilities and equity % % 100.00 % Refer to the results from parts 1, 2, and 3. Did cost of goods sold make up a greater portion of sales for the most recent year? Yes O No Did income as a percent of sales improve in the most recent year? Yes Did plant assets grow over this period? Yes O No

Step by Step Solution

There are 3 Steps involved in it

Step: 1

blur-text-image

Get Instant Access to Expert-Tailored Solutions

See step-by-step solutions with expert insights and AI powered tools for academic success

Step: 2

blur-text-image

Step: 3

blur-text-image

Ace Your Homework with AI

Get the answers you need in no time with our AI-driven, step-by-step assistance

Get Started

Recommended Textbook for

Management Systems Auditing A Practitioners Guide To Quality And Management Systems Audit

Authors: Dr Warren Doudle

1st Edition

B0C6W3G4W4, 979-8397130271

More Books

Students also viewed these Accounting questions

Question

How would we like to see ourselves?

Answered: 1 week ago