Answered step by step
Verified Expert Solution
Question
1 Approved Answer
All Requirements please, thumbs up Requirement 1. Compute the payback, the ARR the NPV, and the profitability index of these two plans Calculate the payback
All Requirements please, thumbs up 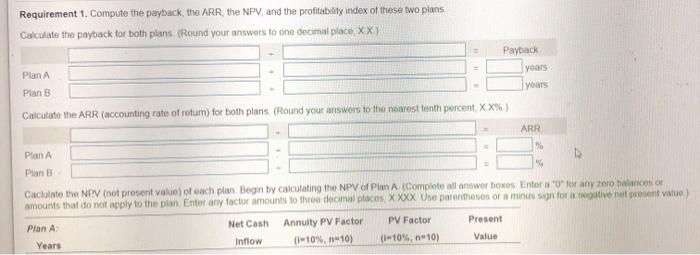
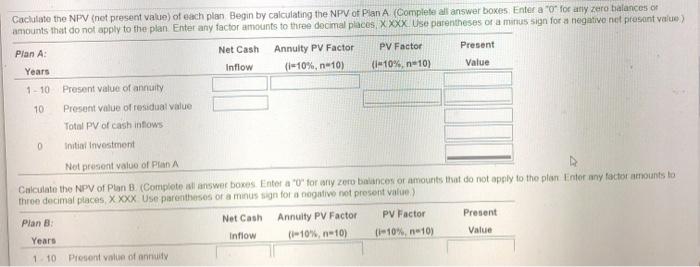
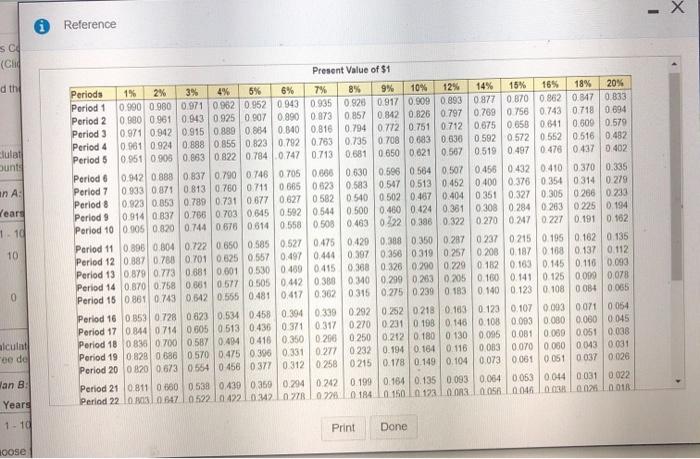
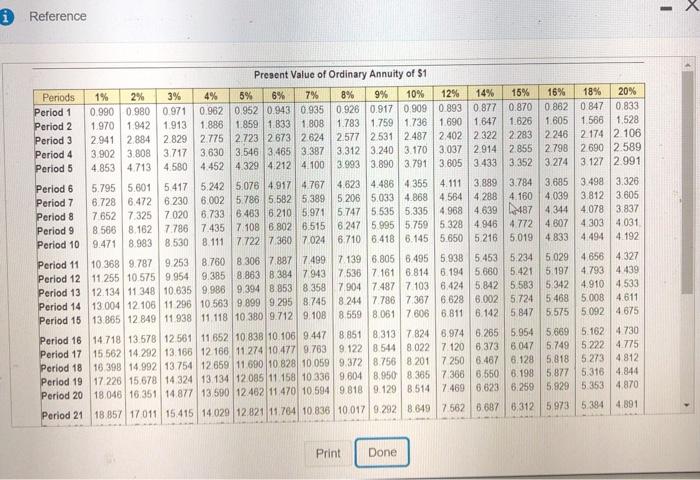
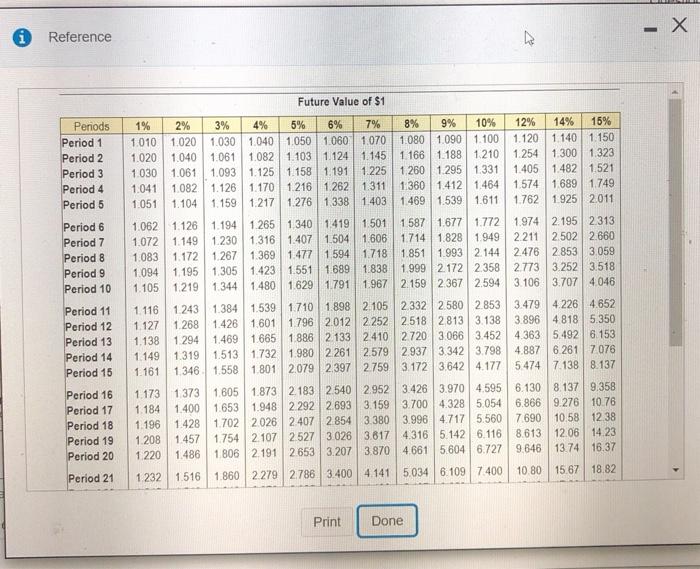
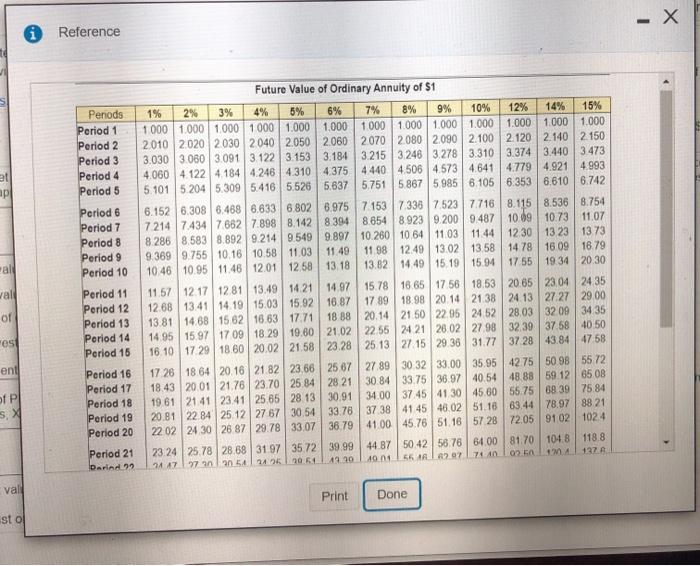
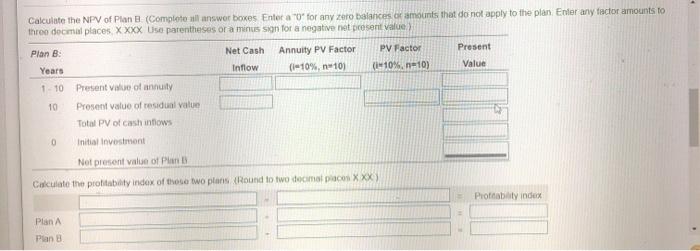


Requirement 1. Compute the payback, the ARR the NPV, and the profitability index of these two plans Calculate the payback for both plans (Round your answers to one decimal place, XX) Payback years Plan yours Plan B Calculate the ARR (accounting rate of return) for both plans (Round your answers to the nearest fenth percent XX%) ARR % Plan A Plan B Caciulate the NPV (not prosent value) of each plan Begin by calculating the NPV of Plan A Complete all answer boxes Enterotor anyo halances or amounts that do not apply to the plan Enter any factor amounts to three decimal places X Xxx Use parentheses or a minus sign for a negative net present value) Plan A Net Cash Annuity PV Factor PV Factor Present Years Inflow (110%, 1410) (I-10%, 10) Value Years Caciulate the NPV (not present value) of each plan Begin by calculating the NPV of Plan A (Complete all answer boxes Enter a "o for any zero balances or amounts that do not apply to the plan. Enter any factor amounts to three decimal places XXXX. Use parentheses or a minus sign for a negative not present value) Plan A: Net Cash Annuity PV Factor PV Factor Present Inflow (-10%, n10) (10%, n=10) Value 1-10 Present value of annuity 10 Present value of residual value Total PV of cash intows 0 Initial investment Net present value of Pan A Calculate the NPV of Plan B (Complete all answer boxes Entora "O" for any zero balances or mounts that do not apply to the plan Enter any factor amounts to three decimal places, X XXX Use parentheses of a minus sign for a negative not present value Plan B Net Cash Annuity PV Factor PV Factor Present Years Inflow (110%, 0-10) (-10%, 10) Value 110 Present value of annully - Reference sc (CH d the 9% clulat unt In A: Keard 1.10 Present Value of $1 Periods 1% 2% 3% 4% 5% 6% 7% 8% 10% 12% 14% 15% 165 18% 20% Period 1 0.990 0.9800.971 0962 0.952 0943 0.935 0.920 0.917 0.909 0.893 0877 0.870 0.862 0.8470.833 Period 2 0.980 0961 0.943 0925 0907 0990 0.873 0.857 0.842 0.826 0.797 0.7690 756 0.743 0.7180894 Period 3 0.971 0.942 0.915 0.889 0.884 0.840 0.816 0.794 0.772 0.751 0.712 0.875 0.6580 641 0.500 0.579 Period 4 0.961 0.9240.888 0 855 0.823 0.792 0.763 0.735 0.708 0 683 0.630 05920.572 0552 0516 0.482 Period 5 0.951 0 905 0.883 0 822 0.7840 747 0.713 0.581 0 650 0.021 0.567 0519 0.497 04760437 0.402 Period 6 0.942 08880837 0790 0746 O 705 0.6660.630 0.596 0 564 0.507 0.456 0.432 04100370 0.335 Period 7 0 933 08710.8130760 07110 665 0.623 0.583 0 547 0.513 0.452 0.400 0.376 0354 03140 279 Period 8 0.923 0.853 0.789 0.731 06770627 0582 0540 0502 0.467 0.4040351 0.327 0.305 0 266 0233 Period 9 0.914 0 837 0.766 0703 0.645 0.59205440.500 0.400 0.424 0.3610308 0.2840263 0 225 194 Period 10 0005 0.820 0.744 0678 0614 0.55805080483 0222 0386 0.322 0 2700 2470 227 0.1910.162 Period 11 0.8950 8040.7220 650 0.585 0.527 0.475 0.429 0.388 0.350 0.287 0237 0215 0.195 0.162 0.135 Period 12 0887 0.750 0.701 0.625 0.557 0.49704440.397 0.358 0 3190 2570 208 0.187 0.168 0.137 0.112 Period 13 0 879 0.773 0.681 0.001 0.530 0.400 0.415 0.368 0.326 0.200 0.229 0.182 0.163 0.145 0.116 0.093 Period 14 0.870 0.758 0.881 0.5770 505 0.4420380 0340 0.299 0.263 0.205 0100 0.141 0.125 0.000 0.078 Period 15 0 861 0.743 0.542 0.555 0.48104170362 0315 0.275 0.2390 1830 140 0.123 0108 0084 0.055 Period 16 0353 0728 0.823 0.534 0.458 0.3940339 0292 0252 0218 0.163 0.123 0.1070093 0071 0054 Period 17 0.844 07140 605 0 513 0.436 0 371 0317 0.270 0231 0 1980 1460108 0.003 0.080 0.060 0045 Period 18 0836 0700 0.587 0.4040416 0.3500 2060 250 0.212 0.180 0 130 0.005 0.0010.089 0.051 0.038 Period 19 0828 0 886 0570 0.475 0.396 0.331 0.277 0232 0.194 0.164 0.116 0.003 0.0700050 0043 0031 Period 20 0820 0.673 05540 456 037703120 258 0215 0.178 0.149 0.1040.073 0061 0051 0 037 0.026 Period 21 0811 0 060 0538 0.430 0359 0.294 0 242 0.1990.164 0.135 0.093 0.064 0053 0044 0031 0.022 Period 220 30 6470 522 10 4221 0342 1078 0728 1.0 1840.150 0.123 0.03 0.05 0.046 10.03 0.025 0.018 10 0 alculat oe de Jan B Years 1 - 10 Print Done hoose X i Reference 2% 4% Present Value of Ordinary Annuity of $1 Periods 1% 3% 5% 6% 7% 8% 9% 10% 12% 14% 15% 16% 18% 20% Period 1 0.990 0.980 0.971 0.962 0.952 0.943 0.935 0.926 0.917 0.909 0.893 0.877 0.870 0.862 0 847 0.833 Period 2 1.970 1942 1.913 1.886 1.859 | 1B33 1,808 1.783 1.759 1.736 1 690 1 647 1.626 1.605 1.566 1528 Period 3 2.9412.884 2.829 2.775 2.7232 673 2624 2.577 2531 2.487 24022 322 2 283 2 246 2174 2.106 Period 4 3.9023 808 3.717 3.630 3.546 3.465 3.387 3.312 3.240 3.170 3.037 2.914 2855 2.798 2690 2.589 Period 5 4.853 4.713 4.580 4.452 4.329 4.212 4 100 3.993 3.890 3.791 3.605 3.433 3.352 3.274 3.127 2.991 Period 6 5.795 5.601 5 417 5.242 5,078 4.917 4 767 4.623 4.486 4355 4.111 3.8893.784 3.685 3.498 3.326 Period 7 6.728 6.472 6.230 6.002 5.786 5.582 5389 5 206 5,033 4.86845644 288 4.160 4.039 3.812 3.605 Period 8 7652 7.3257 020 6.733 6 463 6210 5.971 5.747 5535 5.335 4.968 4639 487 4344 4.078 3.837 Period 9 8 566 8.1627.786 7.435 7 108 6.802 6.515 6.247 5.995 5.759 5 328 4 946 4.772 4 607 4 303 4031 Period 10 9.471 8.9838.530 8. 111 7 722 7360 7024 8.710 6.418 6.145 5.650 5216 5,019 4.833 4.494 4.192 Period 11 10 368 9.787 9.253 8.760 8 306 7.887 7409 7 139 6.805 6.495 5.938 5.453 5.234 5029 4.656 4.327 Period 12 11 255 10.575 9.954 9.385 8.863 8.384 7943 753871616.814 6.194 5.660 5.421 5.197 4.793 4 439 Period 13 12 134 11 348 10.635 9.988 9.394 8.853 8.3587904 7.487 7 103 6.424 5,842 5583 5342 4.910 4533 Period 14 13.004 12 106 11 296 10 563 9.899 9 295 8.745 8.244 77867367 6 628 6.002 5.724 5 468 5008 4.611 Period 15 13.865 12 849 11 938 11.118 10 380 9.712 9.108 8.559 8061 7 606 6.811 6.142 5 847 5.575 5 092 4 675 Period 16 14 718 13.578 12 561 11 652 10 838 10.106 9.447 8.851 8 313 7 824 6.974 6265 5.954 5 669 5.162 4730 Period 17 15 562 14.292 13.166 12 166 11 274 10.477 9.763 9.122 8.5448.0227 120 6.373 6 047 5.749 5222 4.775 Period 18 16 398 14.992 13.754 12659 11.690 10 828 10 059 9.372 8.756 8 2017 250 6.467 6.128 5.818 5273 4812 Period 19 17 226 15.678 14324 13.134 12085 11 158 10 336 9.604 8.950 8.365 7366 6.550 6.198 5.877 5.318 4.844 Period 20 18.046 16.351 14.877 13.590 12.462 11470 10.594 9.818 9.129 8.5147.469 0.623 6.259 5.929 5.353 4.870 Period 21 18 857 17 011 15.415 14 029 12.821 11.764 10.836 10.0179.292 8.6497562 8.6876.312 5973 5384 4.891 Print Done - X Reference Future Value of $1 6% Periods Period 1 Period 2 Period 3 Period 4 Period 5 Period 6 Period 7 Period 8 Period 9 Period 10 1% 2% 3% 4% 5% 7% 8% 9% 10% 12% 14% 15% 1010 1.020 1.030 1.040 1.050 1.060 1070 1.080 1.090 1.100 1.120 1 140 1.150 1.020 1.040 1.061 1.082 1.1031.124 1.145 1 166 1.188 1210 1.254 1.300 1.323 1.030 1.061 1.093 1.125 1.158 1.191 1.225 1.260 1.295 1.331 1.405 1.482 1.521 1.041 1.082 1.126 1.170 1.216 1.262 1.311 1360 1.412 1464 1.574 1689 1749 1.051 1.104 1.159 1.217 1.276 1.338 1.403 1469 1.539 1.611 1.762 1.925 2.011 1.062 1.126 1.1941.265 1340 1.419 1.501 1.587 1.677 1.772 1.974 2195 2.313 1.072 1.149 1.2301.316 1.407 1.504 1.606 1.7141.828 1.949 2.211 2.502 2.660 1.083 1.172 1.267 1.369 1.477 1594 1.718 1.851 1.993 2 144 2476 2 853 3.059 1.094 1.195 1.305 1.423 1.551 1.689 1.838 1.999 2.172 2.358 2.7733.252 3.518 1.105 1.219 1.344 1.480 1.629 1.791 1.967 2 159 2.367 2.594 3.106 3.707 4.046 1.116 1243 1.384 1.539 1710 1.898 2.105 2332 2.580 2.853 3.479 4.226 4,652 1.127 1.268 1.426 1.601 1796 2012 2252 2518 2813 3.138 3.896 4818 5.350 1.138 1 294 1.469 1.665 1886 2133 2410 2720 3.066 3.452 4.363 5.492 6.153 1.149 1.319 1.513 1732 1.980 2261 2.579 2.937 3.342 3.798 4887 6.261 7076 1.161 1 346 1.558 1.801 2.079 2 397 2759 3.172 3.642 4.177 5.474 7.138 8.137 1 173 1373 1.805 1.873 2.183 2.540 2.952 3.426 3.970 4595 6.130 8.137 9.358 1.184 1.400 1.653 1.948 2292 2.693 3.159 3.700 4.328 5054 6.866 9.276 10.76 1.196 1.428 1.702 2026 2407 2854 3.380 3.996 4.717 5.560 7.690 10.58 1238 1 208 1.457 1.754 2107 2527 3.026 3.617 4.316 5.142 6.116 8.613 12.06 14.23 1 220 1486 1 806 2 191 2653 3.207 3.870 4.661 5.6046.727 9.646 13.74 16.37 1.232 1.516 18602279 2786 3.400 4.141 5.034 6.109 7400 10.80 15.67 18.82 Period 11 Period 12 Period 13 Period 14 Period 15 Period 16 Period 17 Period 18 Period 19 Period 20 Period 21 Print Done - X Reference 10% Perods Period 1 Period 2 Period 3 Period 4 Period 5 et Period 6 Period 7 Period 8 Period 9 Period 10 all Future Value of Ordinary Annuity of $1 1% 2% 3% 5% 6% 7% 8% 9% 12% 14% 15% 1.000 1.000 1.000 1000 1.000 1.000 1 000 1.000 1.000 1.000 1.000 1.000 1.000 2010 2020 2030 2040 2050 2060 2070 2080 2090 2.100 2.120 2.140 2 150 3.030 3.060 3.091 3.122 3.153 3.1843.215 3246 3.278 3.310 3.374 3.440 3.473 4,060 4.122 4.1844.246 4.310 4.375 4440 4.506 4.573 4.6414.779 4.921 4.993 5.101 5.204 5.309 5.416 5.526 5.837 5751 58675985 6.105 6.353 6.610 6.742 6.1526.308 6.468 6.633 6.802 6.975 7 153 73367.523 7716 8.115 8,536 8.754 72147.43476827.898 8.142 8.394 8 654 8.923 9.2009.487 10.09 10.73 11.07 8.286 8.5838.892 9.2149549 9.897 10.260 10 64 11.03 11.44 12 30 13 23 13 73 9 369 9.755 10.16 10.58 11.03 | 11.49 11.98 12.49 13.02 13.58 14 78 16 09 16.79 10.46 10.95 11.46 12.01 12:58 13 18 13.82 14.49 15 19 159417 55 19.34 20 30 11 57 12 17 12 8113.49 14.21 14.97 15.78 16.65 1756 18.53 20 65 23 0424 35 1268 13.41 14.19 15.03 15.9216.87 17 89 18.98 20 14 21 38 24.13 27 2729 00 13 81 14 68 15 62 16 63 17.71 18 88 20.14 21.50 22 95 2452 28.03 32 09 34 35 14.95 15 97 17 0918.29 19.60 21.02 22 55 24 21 28.02 27.98 3239 37.58 40 50 16.10 17 2918 60 20.02 21.58 23.28 25 13 27 15 29 36 31.77 37.28 43.8447 58 17 26 18 64 20 16 21 82 23.66 25 67 27 89 30 32 33.00 35.95 4275 50 98 55 72 18.43 20.0121.7623.70 25 8428 21 30.84 33.75 36.97 40.5448.88 59 12 6508 19 61 2141 23 41 25 65 28 13 30.91 34.00 37 4541 30 45 60 55 75 88 39 75.84 20.81 2284 25.12 27 67 30.54 33.76 37 38 41 45 46.02 51.16 63.44 78.97 88 21 22 02 24 30 26 87 29.7833.07 36.79 41.00 45.76 51.16 5728 72.05 9102 1024 23 24 25.7828.68 3197 35.72 39.99 44.87 50 42 56.76 64.00 81.70 104.8 118.8 41.30 40nd 2447197 an lan 54 245 20.54 7440 56 A207 G. M4 127A wall of Fest Period 11 Period 12 Period 13 Period 14 Period 15 ent of PL Period 16 Period 17 Period 18 Period 19 Period 20 S. Period 21 Darin val Print Done sto Calculate the NPV of Plan (Complete all answer boxes Enter a "O' for any zero balances of amounts that do not apply to the plan Enter any factor amounts to thron decimal places X XXX Use parentheses or a minus sign for a negative not present value) Plan B Net Cash Inflow Annuity PV Factor (-10%, 1410) PV Factor (110%, n=10) Present Value Years 110 Present Value of annuity 10 Prosent value of residual value Total PV of cash nows 0 Initial investment Not present value of Plan Calculate the profitability index of these two plans (Round to two decimal places XXX) Protably indeck Plan Plan Requirement 2. What are the strengths and woaknesses of these capital budgeting methods? Match the term with the strengths and weaknesses listed for each of the four capital budgeting models Capital Budgeting Method Strengths/Weaknesses of Capital Budgeting Method is based on cash flows, can be used to assess profitability and takes into account the time value of money. It has none of the weaknesses of the other models is easy to understand, is based on cash flows, and highlights risks However, it ignores profitability and the time value of money Can be used to assess profitability, but it ignores the time value of money It allows us to compare alterative investments in present value terms and it also accounts for differences in the investments initial cost. It has none of the weaknesses of the other models Requirement 3. Which expansion plan should Lulus Company choose? Why? because it has a ARR V profitability index Lulus Company should invest in naytek penod, a not present value and a Requirement 4. Estimate Plan A the IRR compare with the company's required rate of return? Plan son The IRR internal rate of return) Plans This alle the company's hurdle rate of 10 climan list of enter any number in the input fields and then continue to the next question Requirement 1. Compute the payback, the ARR the NPV, and the profitability index of these two plans Calculate the payback for both plans (Round your answers to one decimal place, XX) Payback years Plan yours Plan B Calculate the ARR (accounting rate of return) for both plans (Round your answers to the nearest fenth percent XX%) ARR % Plan A Plan B Caciulate the NPV (not prosent value) of each plan Begin by calculating the NPV of Plan A Complete all answer boxes Enterotor anyo halances or amounts that do not apply to the plan Enter any factor amounts to three decimal places X Xxx Use parentheses or a minus sign for a negative net present value) Plan A Net Cash Annuity PV Factor PV Factor Present Years Inflow (110%, 1410) (I-10%, 10) Value Years Caciulate the NPV (not present value) of each plan Begin by calculating the NPV of Plan A (Complete all answer boxes Enter a "o for any zero balances or amounts that do not apply to the plan. Enter any factor amounts to three decimal places XXXX. Use parentheses or a minus sign for a negative not present value) Plan A: Net Cash Annuity PV Factor PV Factor Present Inflow (-10%, n10) (10%, n=10) Value 1-10 Present value of annuity 10 Present value of residual value Total PV of cash intows 0 Initial investment Net present value of Pan A Calculate the NPV of Plan B (Complete all answer boxes Entora "O" for any zero balances or mounts that do not apply to the plan Enter any factor amounts to three decimal places, X XXX Use parentheses of a minus sign for a negative not present value Plan B Net Cash Annuity PV Factor PV Factor Present Years Inflow (110%, 0-10) (-10%, 10) Value 110 Present value of annully - Reference sc (CH d the 9% clulat unt In A: Keard 1.10 Present Value of $1 Periods 1% 2% 3% 4% 5% 6% 7% 8% 10% 12% 14% 15% 165 18% 20% Period 1 0.990 0.9800.971 0962 0.952 0943 0.935 0.920 0.917 0.909 0.893 0877 0.870 0.862 0.8470.833 Period 2 0.980 0961 0.943 0925 0907 0990 0.873 0.857 0.842 0.826 0.797 0.7690 756 0.743 0.7180894 Period 3 0.971 0.942 0.915 0.889 0.884 0.840 0.816 0.794 0.772 0.751 0.712 0.875 0.6580 641 0.500 0.579 Period 4 0.961 0.9240.888 0 855 0.823 0.792 0.763 0.735 0.708 0 683 0.630 05920.572 0552 0516 0.482 Period 5 0.951 0 905 0.883 0 822 0.7840 747 0.713 0.581 0 650 0.021 0.567 0519 0.497 04760437 0.402 Period 6 0.942 08880837 0790 0746 O 705 0.6660.630 0.596 0 564 0.507 0.456 0.432 04100370 0.335 Period 7 0 933 08710.8130760 07110 665 0.623 0.583 0 547 0.513 0.452 0.400 0.376 0354 03140 279 Period 8 0.923 0.853 0.789 0.731 06770627 0582 0540 0502 0.467 0.4040351 0.327 0.305 0 266 0233 Period 9 0.914 0 837 0.766 0703 0.645 0.59205440.500 0.400 0.424 0.3610308 0.2840263 0 225 194 Period 10 0005 0.820 0.744 0678 0614 0.55805080483 0222 0386 0.322 0 2700 2470 227 0.1910.162 Period 11 0.8950 8040.7220 650 0.585 0.527 0.475 0.429 0.388 0.350 0.287 0237 0215 0.195 0.162 0.135 Period 12 0887 0.750 0.701 0.625 0.557 0.49704440.397 0.358 0 3190 2570 208 0.187 0.168 0.137 0.112 Period 13 0 879 0.773 0.681 0.001 0.530 0.400 0.415 0.368 0.326 0.200 0.229 0.182 0.163 0.145 0.116 0.093 Period 14 0.870 0.758 0.881 0.5770 505 0.4420380 0340 0.299 0.263 0.205 0100 0.141 0.125 0.000 0.078 Period 15 0 861 0.743 0.542 0.555 0.48104170362 0315 0.275 0.2390 1830 140 0.123 0108 0084 0.055 Period 16 0353 0728 0.823 0.534 0.458 0.3940339 0292 0252 0218 0.163 0.123 0.1070093 0071 0054 Period 17 0.844 07140 605 0 513 0.436 0 371 0317 0.270 0231 0 1980 1460108 0.003 0.080 0.060 0045 Period 18 0836 0700 0.587 0.4040416 0.3500 2060 250 0.212 0.180 0 130 0.005 0.0010.089 0.051 0.038 Period 19 0828 0 886 0570 0.475 0.396 0.331 0.277 0232 0.194 0.164 0.116 0.003 0.0700050 0043 0031 Period 20 0820 0.673 05540 456 037703120 258 0215 0.178 0.149 0.1040.073 0061 0051 0 037 0.026 Period 21 0811 0 060 0538 0.430 0359 0.294 0 242 0.1990.164 0.135 0.093 0.064 0053 0044 0031 0.022 Period 220 30 6470 522 10 4221 0342 1078 0728 1.0 1840.150 0.123 0.03 0.05 0.046 10.03 0.025 0.018 10 0 alculat oe de Jan B Years 1 - 10 Print Done hoose X i Reference 2% 4% Present Value of Ordinary Annuity of $1 Periods 1% 3% 5% 6% 7% 8% 9% 10% 12% 14% 15% 16% 18% 20% Period 1 0.990 0.980 0.971 0.962 0.952 0.943 0.935 0.926 0.917 0.909 0.893 0.877 0.870 0.862 0 847 0.833 Period 2 1.970 1942 1.913 1.886 1.859 | 1B33 1,808 1.783 1.759 1.736 1 690 1 647 1.626 1.605 1.566 1528 Period 3 2.9412.884 2.829 2.775 2.7232 673 2624 2.577 2531 2.487 24022 322 2 283 2 246 2174 2.106 Period 4 3.9023 808 3.717 3.630 3.546 3.465 3.387 3.312 3.240 3.170 3.037 2.914 2855 2.798 2690 2.589 Period 5 4.853 4.713 4.580 4.452 4.329 4.212 4 100 3.993 3.890 3.791 3.605 3.433 3.352 3.274 3.127 2.991 Period 6 5.795 5.601 5 417 5.242 5,078 4.917 4 767 4.623 4.486 4355 4.111 3.8893.784 3.685 3.498 3.326 Period 7 6.728 6.472 6.230 6.002 5.786 5.582 5389 5 206 5,033 4.86845644 288 4.160 4.039 3.812 3.605 Period 8 7652 7.3257 020 6.733 6 463 6210 5.971 5.747 5535 5.335 4.968 4639 487 4344 4.078 3.837 Period 9 8 566 8.1627.786 7.435 7 108 6.802 6.515 6.247 5.995 5.759 5 328 4 946 4.772 4 607 4 303 4031 Period 10 9.471 8.9838.530 8. 111 7 722 7360 7024 8.710 6.418 6.145 5.650 5216 5,019 4.833 4.494 4.192 Period 11 10 368 9.787 9.253 8.760 8 306 7.887 7409 7 139 6.805 6.495 5.938 5.453 5.234 5029 4.656 4.327 Period 12 11 255 10.575 9.954 9.385 8.863 8.384 7943 753871616.814 6.194 5.660 5.421 5.197 4.793 4 439 Period 13 12 134 11 348 10.635 9.988 9.394 8.853 8.3587904 7.487 7 103 6.424 5,842 5583 5342 4.910 4533 Period 14 13.004 12 106 11 296 10 563 9.899 9 295 8.745 8.244 77867367 6 628 6.002 5.724 5 468 5008 4.611 Period 15 13.865 12 849 11 938 11.118 10 380 9.712 9.108 8.559 8061 7 606 6.811 6.142 5 847 5.575 5 092 4 675 Period 16 14 718 13.578 12 561 11 652 10 838 10.106 9.447 8.851 8 313 7 824 6.974 6265 5.954 5 669 5.162 4730 Period 17 15 562 14.292 13.166 12 166 11 274 10.477 9.763 9.122 8.5448.0227 120 6.373 6 047 5.749 5222 4.775 Period 18 16 398 14.992 13.754 12659 11.690 10 828 10 059 9.372 8.756 8 2017 250 6.467 6.128 5.818 5273 4812 Period 19 17 226 15.678 14324 13.134 12085 11 158 10 336 9.604 8.950 8.365 7366 6.550 6.198 5.877 5.318 4.844 Period 20 18.046 16.351 14.877 13.590 12.462 11470 10.594 9.818 9.129 8.5147.469 0.623 6.259 5.929 5.353 4.870 Period 21 18 857 17 011 15.415 14 029 12.821 11.764 10.836 10.0179.292 8.6497562 8.6876.312 5973 5384 4.891 Print Done - X Reference Future Value of $1 6% Periods Period 1 Period 2 Period 3 Period 4 Period 5 Period 6 Period 7 Period 8 Period 9 Period 10 1% 2% 3% 4% 5% 7% 8% 9% 10% 12% 14% 15% 1010 1.020 1.030 1.040 1.050 1.060 1070 1.080 1.090 1.100 1.120 1 140 1.150 1.020 1.040 1.061 1.082 1.1031.124 1.145 1 166 1.188 1210 1.254 1.300 1.323 1.030 1.061 1.093 1.125 1.158 1.191 1.225 1.260 1.295 1.331 1.405 1.482 1.521 1.041 1.082 1.126 1.170 1.216 1.262 1.311 1360 1.412 1464 1.574 1689 1749 1.051 1.104 1.159 1.217 1.276 1.338 1.403 1469 1.539 1.611 1.762 1.925 2.011 1.062 1.126 1.1941.265 1340 1.419 1.501 1.587 1.677 1.772 1.974 2195 2.313 1.072 1.149 1.2301.316 1.407 1.504 1.606 1.7141.828 1.949 2.211 2.502 2.660 1.083 1.172 1.267 1.369 1.477 1594 1.718 1.851 1.993 2 144 2476 2 853 3.059 1.094 1.195 1.305 1.423 1.551 1.689 1.838 1.999 2.172 2.358 2.7733.252 3.518 1.105 1.219 1.344 1.480 1.629 1.791 1.967 2 159 2.367 2.594 3.106 3.707 4.046 1.116 1243 1.384 1.539 1710 1.898 2.105 2332 2.580 2.853 3.479 4.226 4,652 1.127 1.268 1.426 1.601 1796 2012 2252 2518 2813 3.138 3.896 4818 5.350 1.138 1 294 1.469 1.665 1886 2133 2410 2720 3.066 3.452 4.363 5.492 6.153 1.149 1.319 1.513 1732 1.980 2261 2.579 2.937 3.342 3.798 4887 6.261 7076 1.161 1 346 1.558 1.801 2.079 2 397 2759 3.172 3.642 4.177 5.474 7.138 8.137 1 173 1373 1.805 1.873 2.183 2.540 2.952 3.426 3.970 4595 6.130 8.137 9.358 1.184 1.400 1.653 1.948 2292 2.693 3.159 3.700 4.328 5054 6.866 9.276 10.76 1.196 1.428 1.702 2026 2407 2854 3.380 3.996 4.717 5.560 7.690 10.58 1238 1 208 1.457 1.754 2107 2527 3.026 3.617 4.316 5.142 6.116 8.613 12.06 14.23 1 220 1486 1 806 2 191 2653 3.207 3.870 4.661 5.6046.727 9.646 13.74 16.37 1.232 1.516 18602279 2786 3.400 4.141 5.034 6.109 7400 10.80 15.67 18.82 Period 11 Period 12 Period 13 Period 14 Period 15 Period 16 Period 17 Period 18 Period 19 Period 20 Period 21 Print Done - X Reference 10% Perods Period 1 Period 2 Period 3 Period 4 Period 5 et Period 6 Period 7 Period 8 Period 9 Period 10 all Future Value of Ordinary Annuity of $1 1% 2% 3% 5% 6% 7% 8% 9% 12% 14% 15% 1.000 1.000 1.000 1000 1.000 1.000 1 000 1.000 1.000 1.000 1.000 1.000 1.000 2010 2020 2030 2040 2050 2060 2070 2080 2090 2.100 2.120 2.140 2 150 3.030 3.060 3.091 3.122 3.153 3.1843.215 3246 3.278 3.310 3.374 3.440 3.473 4,060 4.122 4.1844.246 4.310 4.375 4440 4.506 4.573 4.6414.779 4.921 4.993 5.101 5.204 5.309 5.416 5.526 5.837 5751 58675985 6.105 6.353 6.610 6.742 6.1526.308 6.468 6.633 6.802 6.975 7 153 73367.523 7716 8.115 8,536 8.754 72147.43476827.898 8.142 8.394 8 654 8.923 9.2009.487 10.09 10.73 11.07 8.286 8.5838.892 9.2149549 9.897 10.260 10 64 11.03 11.44 12 30 13 23 13 73 9 369 9.755 10.16 10.58 11.03 | 11.49 11.98 12.49 13.02 13.58 14 78 16 09 16.79 10.46 10.95 11.46 12.01 12:58 13 18 13.82 14.49 15 19 159417 55 19.34 20 30 11 57 12 17 12 8113.49 14.21 14.97 15.78 16.65 1756 18.53 20 65 23 0424 35 1268 13.41 14.19 15.03 15.9216.87 17 89 18.98 20 14 21 38 24.13 27 2729 00 13 81 14 68 15 62 16 63 17.71 18 88 20.14 21.50 22 95 2452 28.03 32 09 34 35 14.95 15 97 17 0918.29 19.60 21.02 22 55 24 21 28.02 27.98 3239 37.58 40 50 16.10 17 2918 60 20.02 21.58 23.28 25 13 27 15 29 36 31.77 37.28 43.8447 58 17 26 18 64 20 16 21 82 23.66 25 67 27 89 30 32 33.00 35.95 4275 50 98 55 72 18.43 20.0121.7623.70 25 8428 21 30.84 33.75 36.97 40.5448.88 59 12 6508 19 61 2141 23 41 25 65 28 13 30.91 34.00 37 4541 30 45 60 55 75 88 39 75.84 20.81 2284 25.12 27 67 30.54 33.76 37 38 41 45 46.02 51.16 63.44 78.97 88 21 22 02 24 30 26 87 29.7833.07 36.79 41.00 45.76 51.16 5728 72.05 9102 1024 23 24 25.7828.68 3197 35.72 39.99 44.87 50 42 56.76 64.00 81.70 104.8 118.8 41.30 40nd 2447197 an lan 54 245 20.54 7440 56 A207 G. M4 127A wall of Fest Period 11 Period 12 Period 13 Period 14 Period 15 ent of PL Period 16 Period 17 Period 18 Period 19 Period 20 S. Period 21 Darin val Print Done sto Calculate the NPV of Plan (Complete all answer boxes Enter a "O' for any zero balances of amounts that do not apply to the plan Enter any factor amounts to thron decimal places X XXX Use parentheses or a minus sign for a negative not present value) Plan B Net Cash Inflow Annuity PV Factor (-10%, 1410) PV Factor (110%, n=10) Present Value Years 110 Present Value of annuity 10 Prosent value of residual value Total PV of cash nows 0 Initial investment Not present value of Plan Calculate the profitability index of these two plans (Round to two decimal places XXX) Protably indeck Plan Plan Requirement 2. What are the strengths and woaknesses of these capital budgeting methods? Match the term with the strengths and weaknesses listed for each of the four capital budgeting models Capital Budgeting Method Strengths/Weaknesses of Capital Budgeting Method is based on cash flows, can be used to assess profitability and takes into account the time value of money. It has none of the weaknesses of the other models is easy to understand, is based on cash flows, and highlights risks However, it ignores profitability and the time value of money Can be used to assess profitability, but it ignores the time value of money It allows us to compare alterative investments in present value terms and it also accounts for differences in the investments initial cost. It has none of the weaknesses of the other models Requirement 3. Which expansion plan should Lulus Company choose? Why? because it has a ARR V profitability index Lulus Company should invest in naytek penod, a not present value and a Requirement 4. Estimate Plan A the IRR compare with the company's required rate of return? Plan son The IRR internal rate of return) Plans This alle the company's hurdle rate of 10 climan list of enter any number in the input fields and then continue to the next 


Step by Step Solution
There are 3 Steps involved in it
Step: 1

Get Instant Access to Expert-Tailored Solutions
See step-by-step solutions with expert insights and AI powered tools for academic success
Step: 2

Step: 3

Ace Your Homework with AI
Get the answers you need in no time with our AI-driven, step-by-step assistance
Get Started


