Answered step by step
Verified Expert Solution
Question
1 Approved Answer
All the fomulas below must be answed by plugging in and using numbers written below. Ratio Liquidity and Efficiency Current ratio Acid-test ratio Accounts receivable
All the fomulas below must be answed by plugging in and using numbers written below. 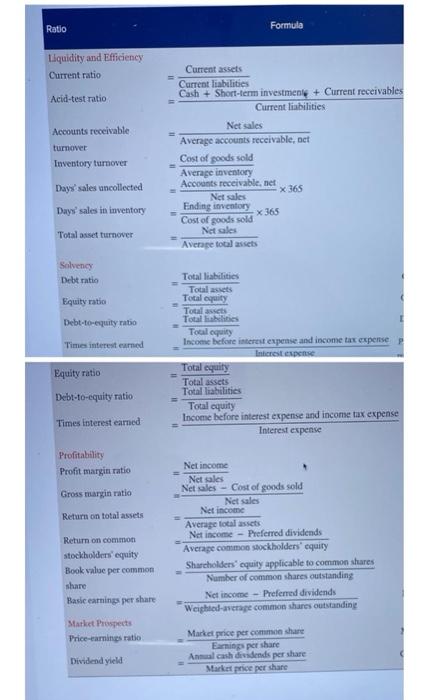
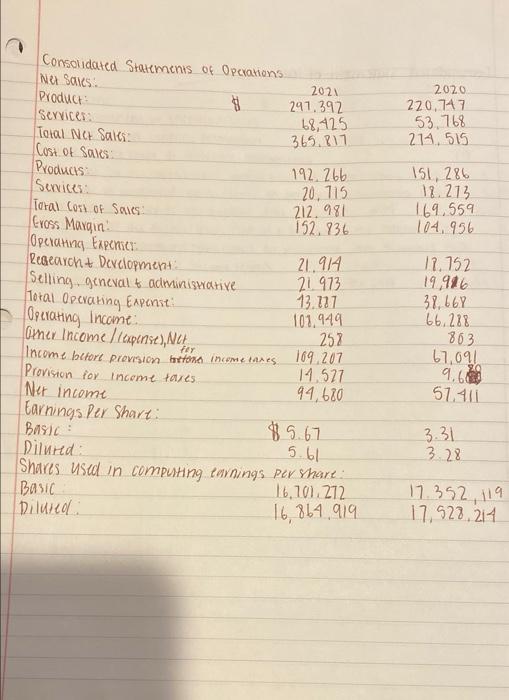
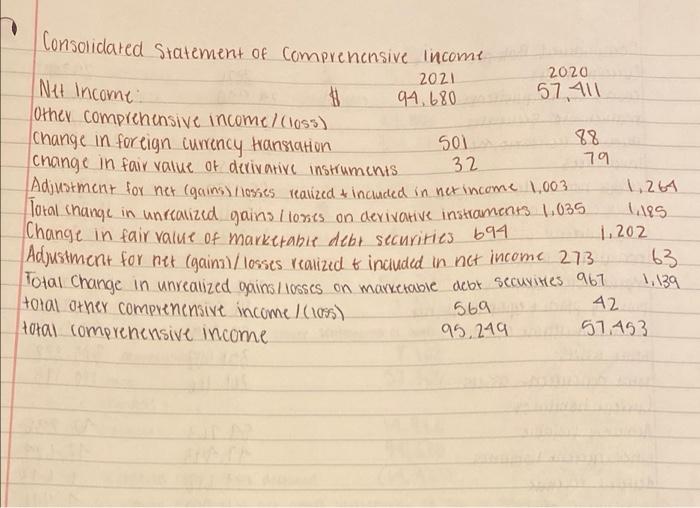
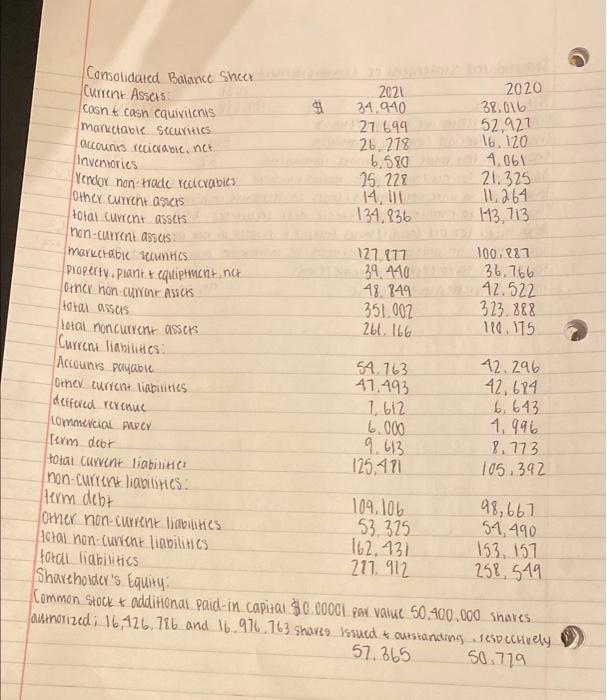
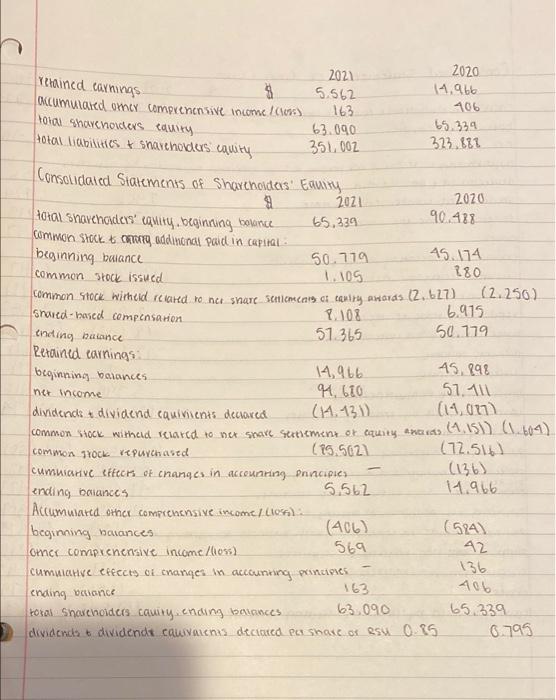
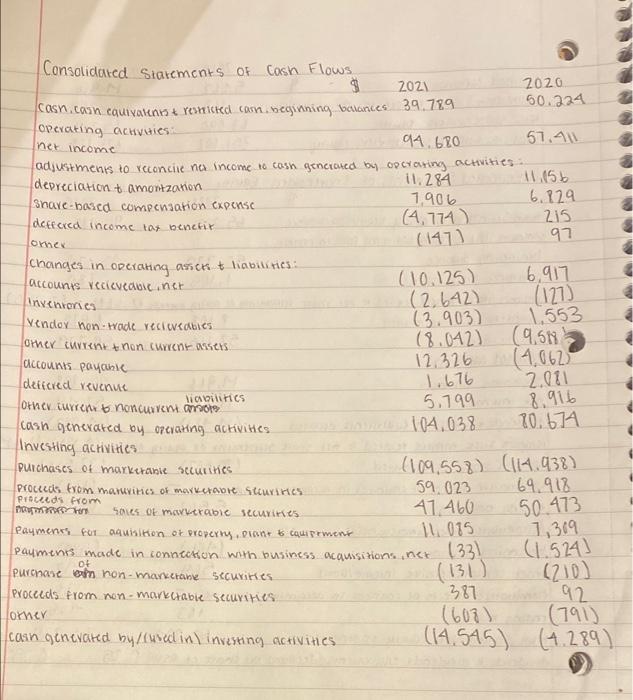
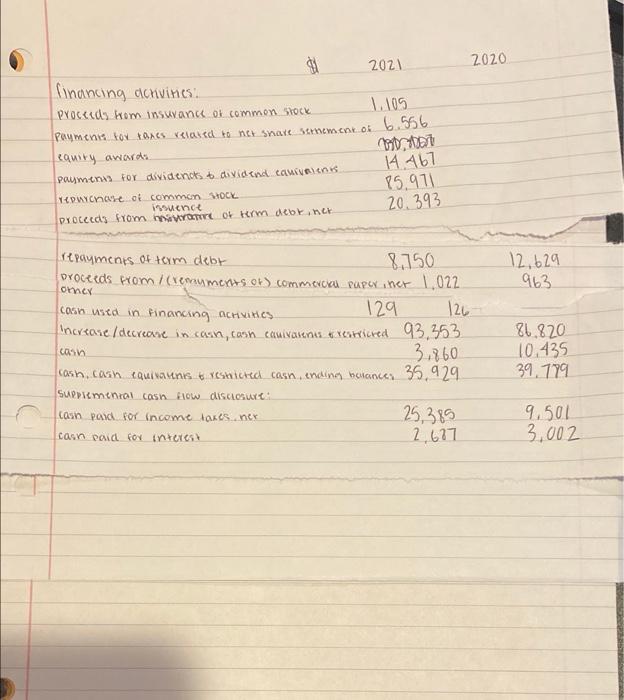
Ratio Liquidity and Efficiency Current ratio Acid-test ratio Accounts receivable turnover Inventory turnover Days' sales uncollected Days' sales in inventory Total asset turnover Solvency Debt ratio Equity ratio Debt-to-equity ratio Times interest earned Equity ratio Debt-to-equity ratio Times interest earned Profitability Profit margin ratio Gross margin ratio Return on total assets Return on common stockholders' equity Book value per common share Basic earnings per share Market Prospects Price-earnings ratio Dividend yield T Formula Current assets Current liabilities Cash + Short-term investment + Current receivables Current liabilities. Net sales Average accounts receivable, net Cost of goods sold Average inventory Accounts receivable, net x 365 Net sales Ending inventory x 365 Cost of goods sold Net sales Average total assets Total liabilities Total assets Total equity Total assets Total liabilities Total equity Income before interest expense and income tax expense p Interest expense Total equity Total assets Total liabilities Total equity Income before interest expense and income tax expense Interest expense Net income Net sales Cost of goods sold = Net sales Net sales Net income Average total assets Net income Preferred dividends Average common stockholders' equity Shareholders' equity applicable to common shares Number of common shares outstanding Net income Preferred dividends Weighted-average common shares outstanding Market price per common share Earnings per share Annual cash dividends per share Market price per share Consolidated Statements of Operations. Net Sales Product $ Services: Total Not Sales: Cost of Sales: Products Services: Total Cost of Sales: Gross Margin Operating Expenser Research & Development... Selling genevalt administrative Total Operating Expense: Operating Income Omer Income /expense), Net Income before provision before income taxes. Provision for Income taxes. Ner income Earnings Per Shart: $5.67 Basic: Dilured: 5.61 Shares used in computing earnings Per Share: Basic 16,701.272 Diluted: 16,864,919 2021 297.392 68,425 365.817 192.266 20,715 212.981 152.836 21.914 21 973 13.237 101,949 258 169,207 14.527 94,680 2020 220,747 53,768 214, 515 151, 286 18.273 169.559 104,956 18.752 19,986 38,668 66.288 863 67,091 9.60 57.411 3.31 3.28 17.352,119 17,528,214 1 Consolidated Statement of Comprehensive income 2021 Net Income 2020 57,411 # 94,680 501 88 32 79 Other comprehensive income / (los) Change in foreign currency translation change in fair value of derivative instruments Adjustment for net (gains) / losses realized & included in net income 1,003 Total change in unrealized gains / losses on derivative instraments 1.035 Change in fair value of marketable debt securities Adjustment for net (gains) / losses realized & included in net income 273 Total Change in unrealized gains/losses on marketable debt securities 967 total other comprenensive income / (1095) 694 1.202 42 569 95,249 total comprehensive income 57.453 1,261 1.185 63 1,139 Consolidated Balance Sheet Current Assets 38.016 Cosnt cash cquivitenis marketable Securities 52,927 16.120 accounts recierabie, net Inventories. 1,061 21.325 Vendor non-trade recierables 11264 Other current assets 113,713 total current assets non-current assets: 100.887 marketable securities 36.766 Property, plant + equipment, not 42.522 Jother non-current Assets. 323.888 total assers 110, 175 total noncurrent assets Current liabilities 12.296 Accounts payable 42,684 Other current liabilities. 6.643 deffered revenue 1,996 commercial PAP CY Term deor 8.773 total current liabilinc 105.392 non-current liabilities: term debt 98,667 other non-current liabilities 53,325 54,490 162,431 153, 157 Actal non-current liabilities total liabilities Shareholder's Equity: 277.912 258, 549 Common Stock + additional Paid-in capital $0.00001 par value 50.400.000 shares authorized: 16,426. 786 and 16.976 763 shares Issued & outstanding respectively 57.365 50.779 EF 2021 34,940 27.699 26,278 6,580 25.228 14, 111 134,836 127.877 39,440 48. 849 351.002 261. 166 54.763 47.493 7,612 6.000 9.613 125,471 109.106 2020 2021 5.562 163 63.090 351,002 retained earnings. $ accumulated other comprehensive income /(less) total shareholders equity. total liabilities & shareholders equity Consolidated Statements of Shareholders' 9 90.488 65.339 total shareholders equity, beginning bolince common stock & corony additional paid in capital. beginning balance 50.779 45.174 880 common stock issued. 1.105. common stock witheld related to her share senilemears of cavity awards (2.627) shared-based compensation 8.108 6.915 ending balance 57.365 50.179 Retained earnings 14,966 45,898 beginning balances 94,610 57. 111 net income (14.131) (14,087) dividends + dividend equiviients declared common stock withald related to not share settlement of equity anciras (4.15)) (1.609) (15.502) (72.516) common Trock repurchased - (136) cumulative effects of changes in accounting Priviciples. 5.562 11.966 ending balances Accumulated other comprehensive income / (1055) (406) (584) beginning balances 569 42 omer comprehensive income /(loss) 136 cumulative effects of changes in accounting principles 163 106 ending balance 63.090 65.339 total Shareholders cquity ending balances dividends & dividends cauivalents declared por share or BSH 0.85 Equity 2020 11.966 106 65.339 323.888 2020 2021 (2.250) 6.795 Consolidated Statements of Cash Flows $ 2021 2020. 50.224 cash.cash equivalents & restricted carn, beginning balances 39.789 Operating activities 94.680 57.411 net income adjustments to reconcile net income to cash generated by operating activities: depreciation tamonitzation. 11.284 11.156 Share-based compensation expense 1,906 deffered income tax benefit (4,774) other (147) changes in operating assets & liabilities: accounts recievedbic.net (10.125) inventories (2,642) vendor non-trade recieveables (3.903) (8.042) (9.51) other current + non current assets. accounts payable 12,326 (4,062) deffered revenue 1.676 2.081 liabilitics other current to noncurrent amo 5.799 8,916 104,038 70.674 cash generated by operating activities. Investing activities Purchases of marketable securities (109,558) (114.938) proceeds from maturitics of marketable securities. Proceeds from 59.023 69.918 PRIRED Sales of marketable securities 41,460 50.473 11.075 7,369 Payments for aquisition of property, plant to cquipement Payments made in connection with business acquisitions, net (33) (1.524) Purchase of non-marketable securities (131) (210) 92 Proceeds from non-marketable securities 387 (608) (791) other cash generated by /(used in) investing activities. (14.545) (4.289) 6.829 215 97 6,917 (127) 1.553 ( 4 2021 1.105 $1 financing activities proceeds from insurance of common stock 6.556 Payments for taxes related to not share setnement of equity awards 14 467 Payments for dividencts to dividend equivalents. 85.971 repurchase of common stock. issuence 20.393 proceeds from mistrative of term debt, net repayments of term debt 8.750 proceeds from/(remuments of) commercial paper, her 1,022 other cash used in financing activities. 129 126 Increase / decrease in cash, cash cauivalents & restricted 93,353 cash 3,860 cash, cash equivaunis & restricted cash, ending balances 35,929 Supplemental cash flow disclosure: cash paid for income taxes ner 25,385 cash paid for interest 2,637 2020 12,629 963 86.820 10.435 39.779 9.501 3,002 


Step by Step Solution
There are 3 Steps involved in it
Step: 1

Get Instant Access to Expert-Tailored Solutions
See step-by-step solutions with expert insights and AI powered tools for academic success
Step: 2

Step: 3

Ace Your Homework with AI
Get the answers you need in no time with our AI-driven, step-by-step assistance
Get Started


