All the information is provided below. The entire question and the excel data that will be needed to work these problems. Thank you in advance
All the information is provided below. The entire question and the excel data that will be needed to work these problems. Thank you in advance for your help.
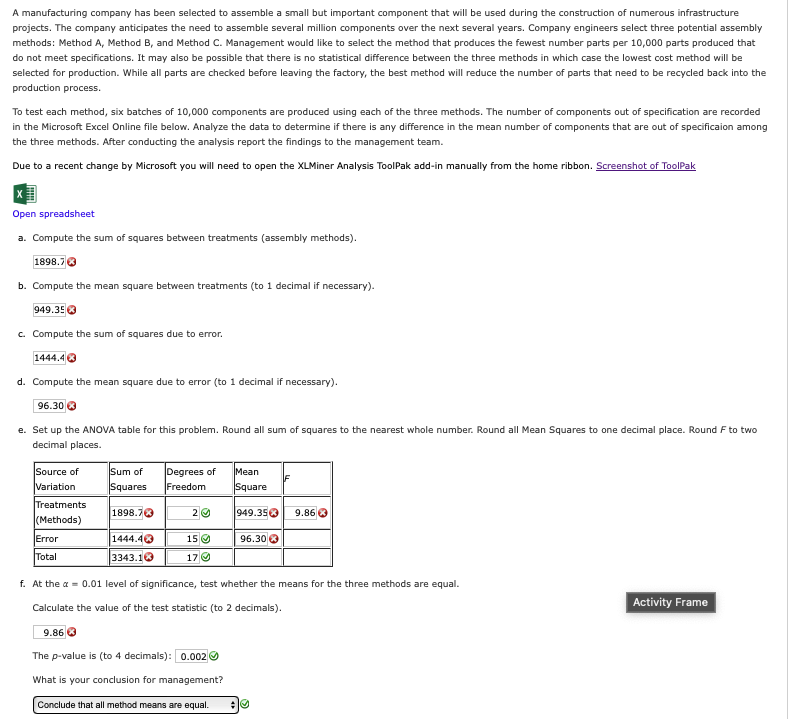
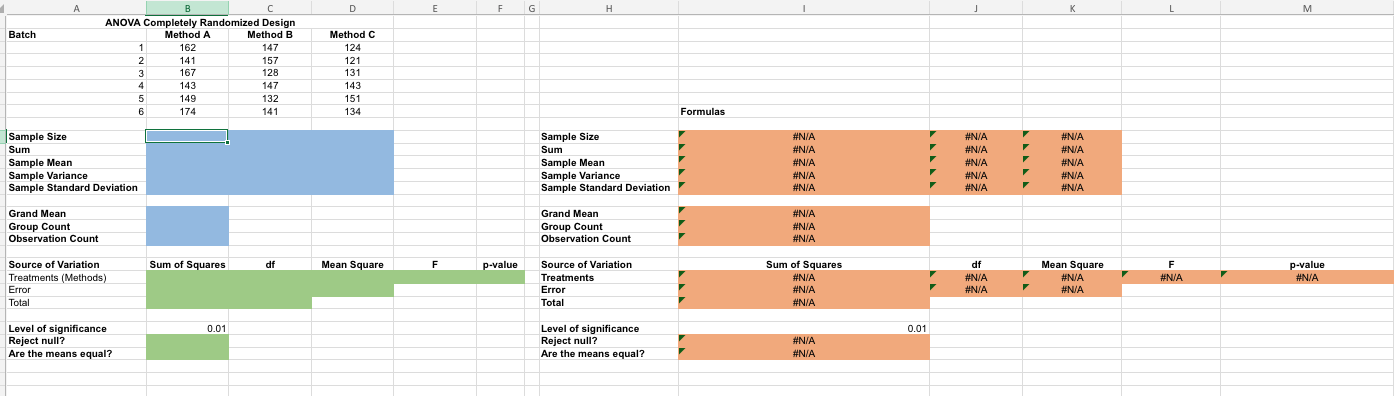
A manufacturing company has been selected to assemble a small but important component that will be used during the construction of numerous infrastructure projects. The company anticipates the need to assemble several million components over the next several years. Company engineers select three potential assembly methods: Method A, Method B, and Method C. Management would like to select the method that produces the fewest number parts per 10,000 parts produced that do not meet specifications. It may also be possible that there is no statistical difference between the three methods in which case the lowest cost method will be selected for production. While all parts are checked before leaving the factory, the best method will reduce the number of parts that need to be recycled back into the production process. To test each method, six batches of 10,000 components are produced using each of the three methods. The number of components out of specification are recorded in the Microsoft Excel Online file below. Analyze the data to determine if there is any difference in the mean number of components that are out of specificaion among the three methods. After conducting the analysis report the findings to the management team. Due to a recent change by Microsoft you will need to open the XLMiner Analysis ToolPak add-in manually from the home ribbon. Screenshot of ToolPak Open spreadsheet a. Compute the sum of squares between treatments (assembly methods). 1898.7 0 b. Compute the mean square between treatments (to 1 decimal if necessary). 949.35 63 C. Compute the sum of squares due to error. 1444.40 d. Compute the mean square due to error (to 1 decimal if necessary). 96.30 0 e. Set up the ANOVA table for this problem. Round all sum of squares to the nearest whole number. Round all Mean Squares to one decimal place. Round F to two decimal places. Source of Sum of Degrees of Mean Variation Square Freedom Square Treatments 1898.70 949.350 9.860 [Methods Error 1444.40 15 @ 96.30 0 Total 3343.160 17@ f. At the a = 0.01 level of significance, test whether the means for the three methods are equal. Activity Frame Calculate the value of the test statistic (to 2 decimals). 9.86 0 The p-value is (to 4 decimals): 0.0020 What is your conclusion for management? Conclude that all method means are equal.i A | B | c D E F G H 1 1 K L M ANOVA Completely Randomized Design Batch Method A Method B Method C 1 162 147 124 2 141 157 121 3 167 128 131 4 143 1 143 5 143 132 151 B 174 141 134 FormulasSampln Size 'Sample Size Sum Sum Sample Mean 'Sample Mean Sample Variance 'Sample Variance Sample Standard Deviation 'Sample Standard Deviation Grand Mean Grand Mean Group Count Group Count Observation Count Observation Count Source of Variation Mean Square Source of Variation Sum of Squares. df Mean Square F lue \"Treatments (Mathars) Troatments Error Error Total Total Level of significance Level of significance Reject null? Reject null? Mmoo [ M F e
Step by Step Solution
There are 3 Steps involved in it
Step: 1
Get Instant Access to Expert-Tailored Solutions
See step-by-step solutions with expert insights and AI powered tools for academic success
Step: 2
Step: 3
Ace Your Homework with AI
Get the answers you need in no time with our AI-driven, step-by-step assistance