

Answered step by step
Verified Expert Solution
Question
1 Approved Answer
All Work on Excel Please with cell references! thanks! Sales Growth COGS/Sales Mean 4% 50% St. Dev. 3.00% 8% Fixed Costs NWC as % of
All Work on Excel Please with cell references! thanks!
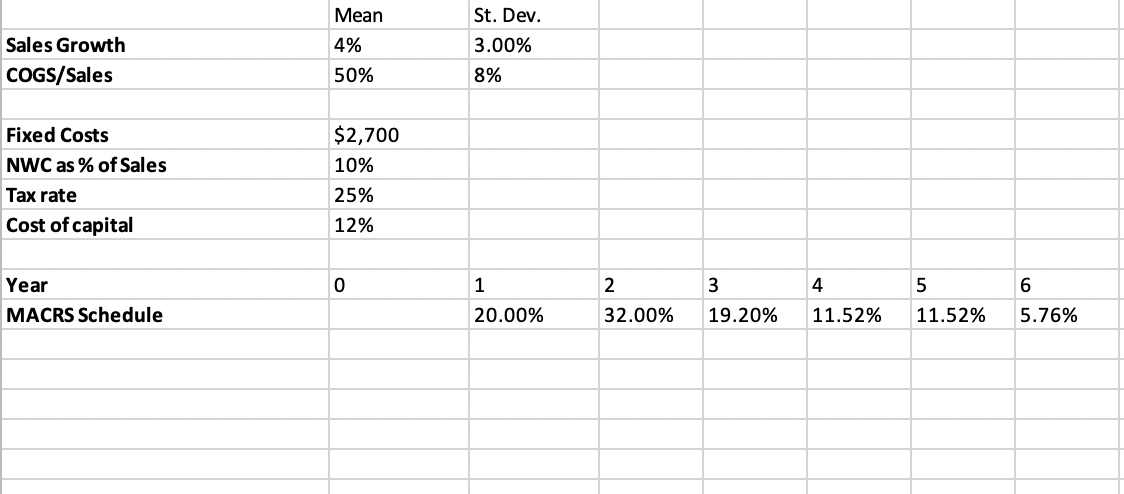
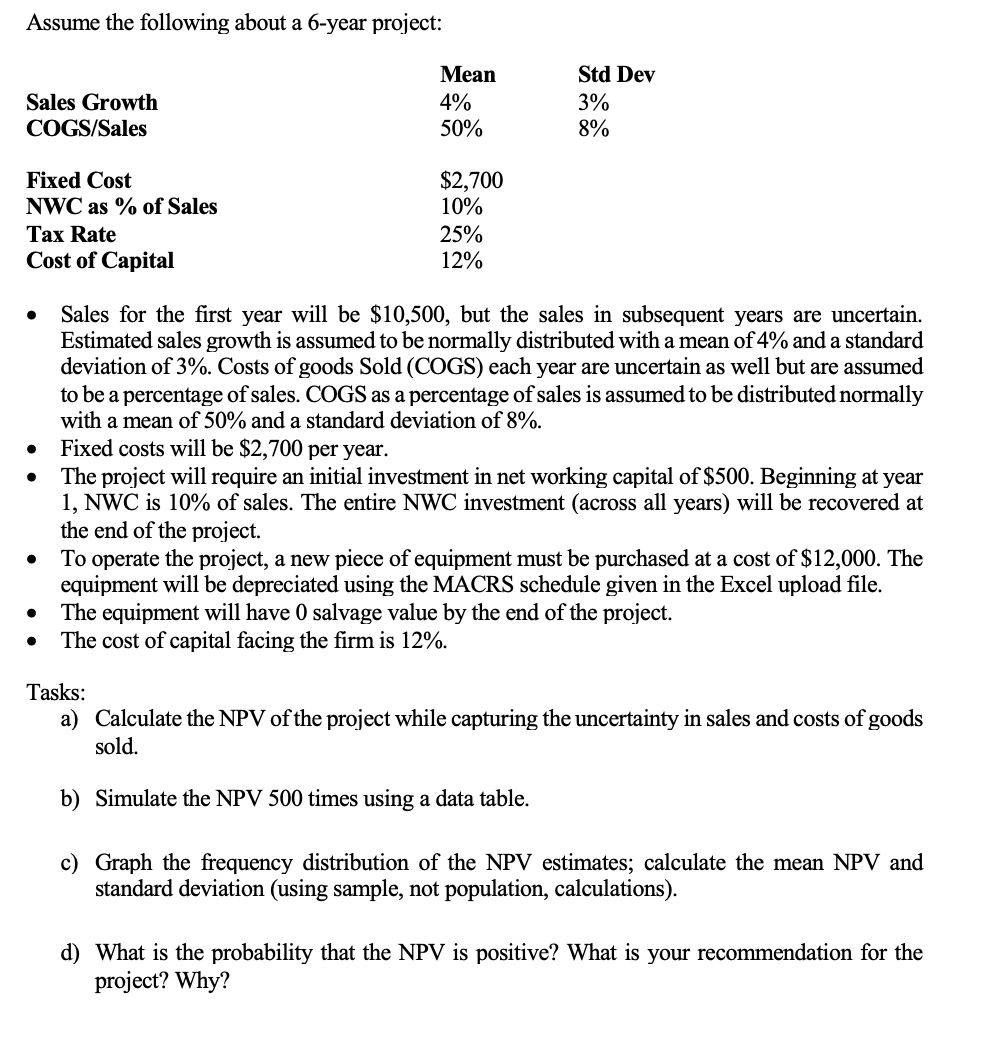
Sales Growth COGS/Sales Mean 4% 50% St. Dev. 3.00% 8% Fixed Costs NWC as % of Sales Tax rate Cost of capital $2,700 10% 25% 12% 0 Year MACRS Schedule 1 20.00% 2 32.00% 3 19.20% 4 11.52% 5 11.52% 6 5.76% Assume the following about a 6-year project: Mean 4% Sales Growth COGS/Sales Std Dev 3% 8% 50% Fixed Cost NWC as % of Sales Tax Rate Cost of Capital $2,700 10% 25% 12% Sales for the first year will be $10,500, but the sales in subsequent years are uncertain. Estimated sales growth is assumed to be normally distributed with a mean of 4% and a standard deviation of 3%. Costs of goods Sold (COGS) each year are uncertain as well but are assumed to be a percentage of sales. COGS as a percentage of sales is assumed to be distributed normally with a mean of 50% and a standard deviation of 8%. Fixed costs will be $2,700 per year. The project will require an initial investment in net working capital of $500. Beginning at year 1, NWC is 10% of sales. The entire NWC investment (across all years) will be recovered at the end of the project. To operate the project, a new piece of equipment must be purchased at a cost of $12,000. The equipment will be depreciated using the MACRS schedule given in the Excel upload file. The equipment will have 0 salvage value by the end of the project. The cost of capital facing the firm is 12%. Tasks: a) Calculate the NPV of the project while capturing the uncertainty in sales and costs of goods sold. b) Simulate the NPV 500 times using a data table. c) Graph the frequency distribution of the NPV estimates; calculate the mean NPV and standard deviation (using sample, not population, calculations). d) What is the probability that the NPV is positive? What is your recommendation for the project? Why? Sales Growth COGS/Sales Mean 4% 50% St. Dev. 3.00% 8% Fixed Costs NWC as % of Sales Tax rate Cost of capital $2,700 10% 25% 12% 0 Year MACRS Schedule 1 20.00% 2 32.00% 3 19.20% 4 11.52% 5 11.52% 6 5.76% Assume the following about a 6-year project: Mean 4% Sales Growth COGS/Sales Std Dev 3% 8% 50% Fixed Cost NWC as % of Sales Tax Rate Cost of Capital $2,700 10% 25% 12% Sales for the first year will be $10,500, but the sales in subsequent years are uncertain. Estimated sales growth is assumed to be normally distributed with a mean of 4% and a standard deviation of 3%. Costs of goods Sold (COGS) each year are uncertain as well but are assumed to be a percentage of sales. COGS as a percentage of sales is assumed to be distributed normally with a mean of 50% and a standard deviation of 8%. Fixed costs will be $2,700 per year. The project will require an initial investment in net working capital of $500. Beginning at year 1, NWC is 10% of sales. The entire NWC investment (across all years) will be recovered at the end of the project. To operate the project, a new piece of equipment must be purchased at a cost of $12,000. The equipment will be depreciated using the MACRS schedule given in the Excel upload file. The equipment will have 0 salvage value by the end of the project. The cost of capital facing the firm is 12%. Tasks: a) Calculate the NPV of the project while capturing the uncertainty in sales and costs of goods sold. b) Simulate the NPV 500 times using a data table. c) Graph the frequency distribution of the NPV estimates; calculate the mean NPV and standard deviation (using sample, not population, calculations). d) What is the probability that the NPV is positive? What is your recommendation for the project? WhyStep by Step Solution
There are 3 Steps involved in it
Step: 1

Get Instant Access to Expert-Tailored Solutions
See step-by-step solutions with expert insights and AI powered tools for academic success
Step: 2

Step: 3
Ace Your Homework with AI
Get the answers you need in no time with our AI-driven, step-by-step assistance
Get Started
Handbook Of Frontier Markets Evidence From Middle East North Africa And International Comparative Studies
Authors: Panagiotis Andrikopoulos , Greg N. Gregoriou , Vasileios Kallinterakis
1st Edition
0128092009,0128094915