

Question
### Allowable packages The only allowable package is `tidyverse`. You should not use any other packages. ### Data Set The data set for this assignment
### Allowable packages
The only allowable package is `tidyverse`. You should not use any other packages.
### Data Set
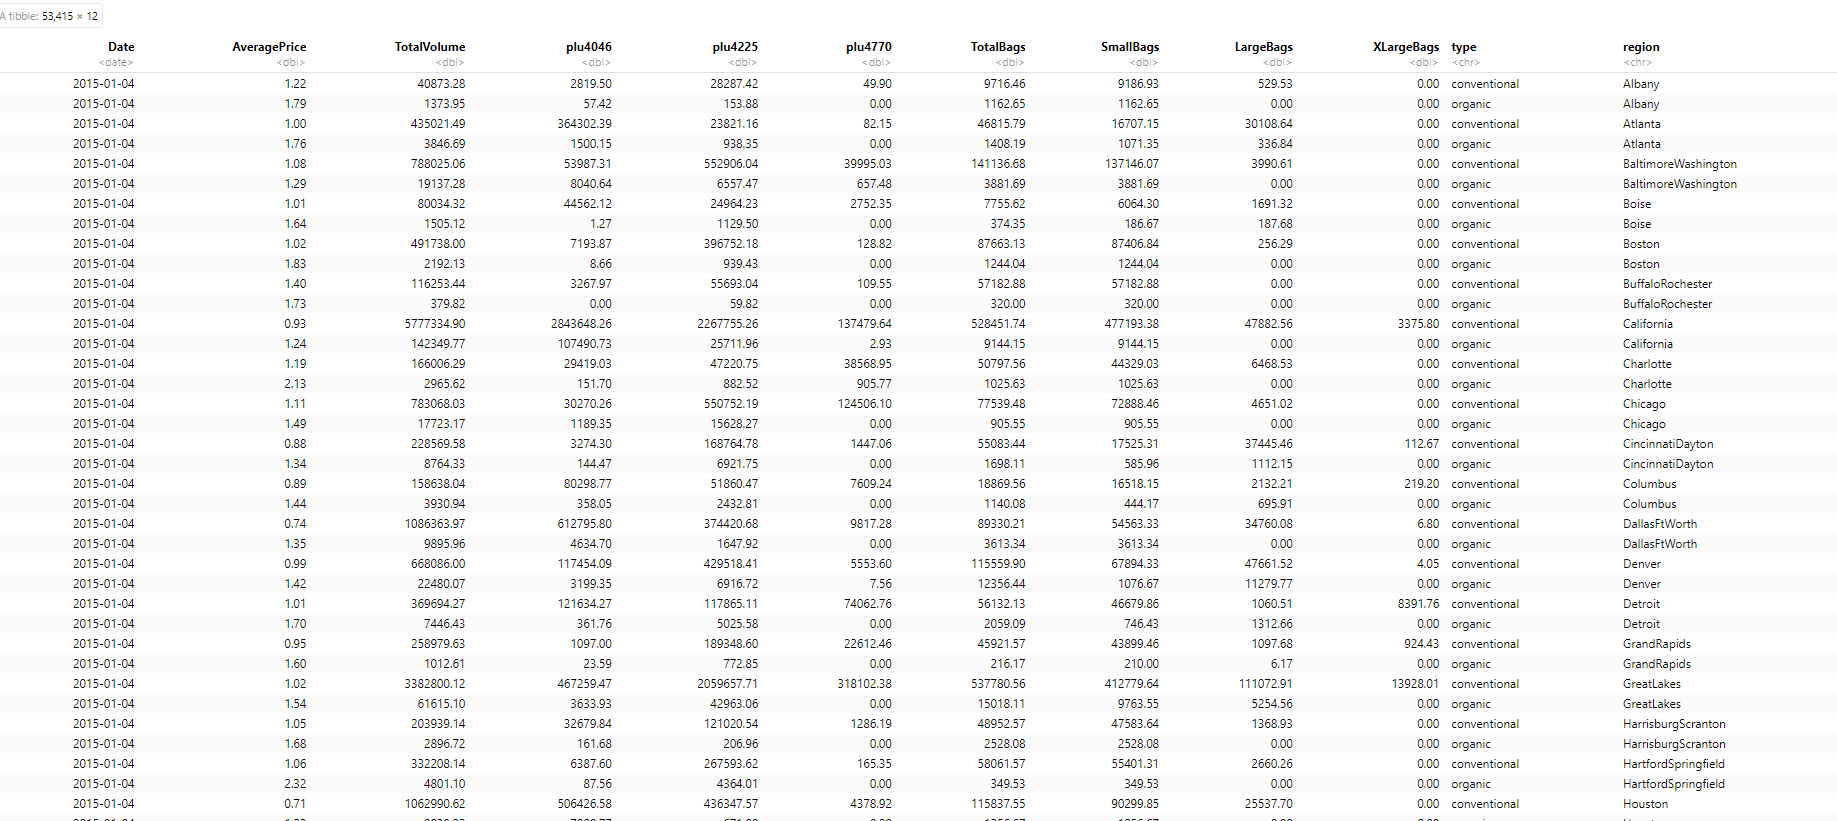
The data set for this assignment is called **`avocados`**. The data was collected by the Hass Avocado Board to track the proce and sales volume of Hass avocados from 2015 to 2023. More information is available on Kaggle [here](https://www.kaggle.com/datasets/vakhariapujan/avocado-prices-and-sales-volume-2015-2023?resource=download).
Create a correlation matrix of the relationships between Year, Month, AveragePrice, and type_bin for the Northeast region.
- Assign the matrix to Q3. It should look something like this:
```
Year Month AveragePrice type_bin
Year [value] [value] [value] [value]
Month [value] [value] [value] [value]
AveragePrice [value] [value] [value] [value]
type_bin [value] [value] [value] [value]
Step by Step Solution
There are 3 Steps involved in it
Step: 1

Get Instant Access to Expert-Tailored Solutions
See step-by-step solutions with expert insights and AI powered tools for academic success
Step: 2

Step: 3
Ace Your Homework with AI
Get the answers you need in no time with our AI-driven, step-by-step assistance
Get Started
Linear Algebra A Modern Introduction
Authors: David Poole
3rd edition
9781133169574 , 978-0538735452