Question
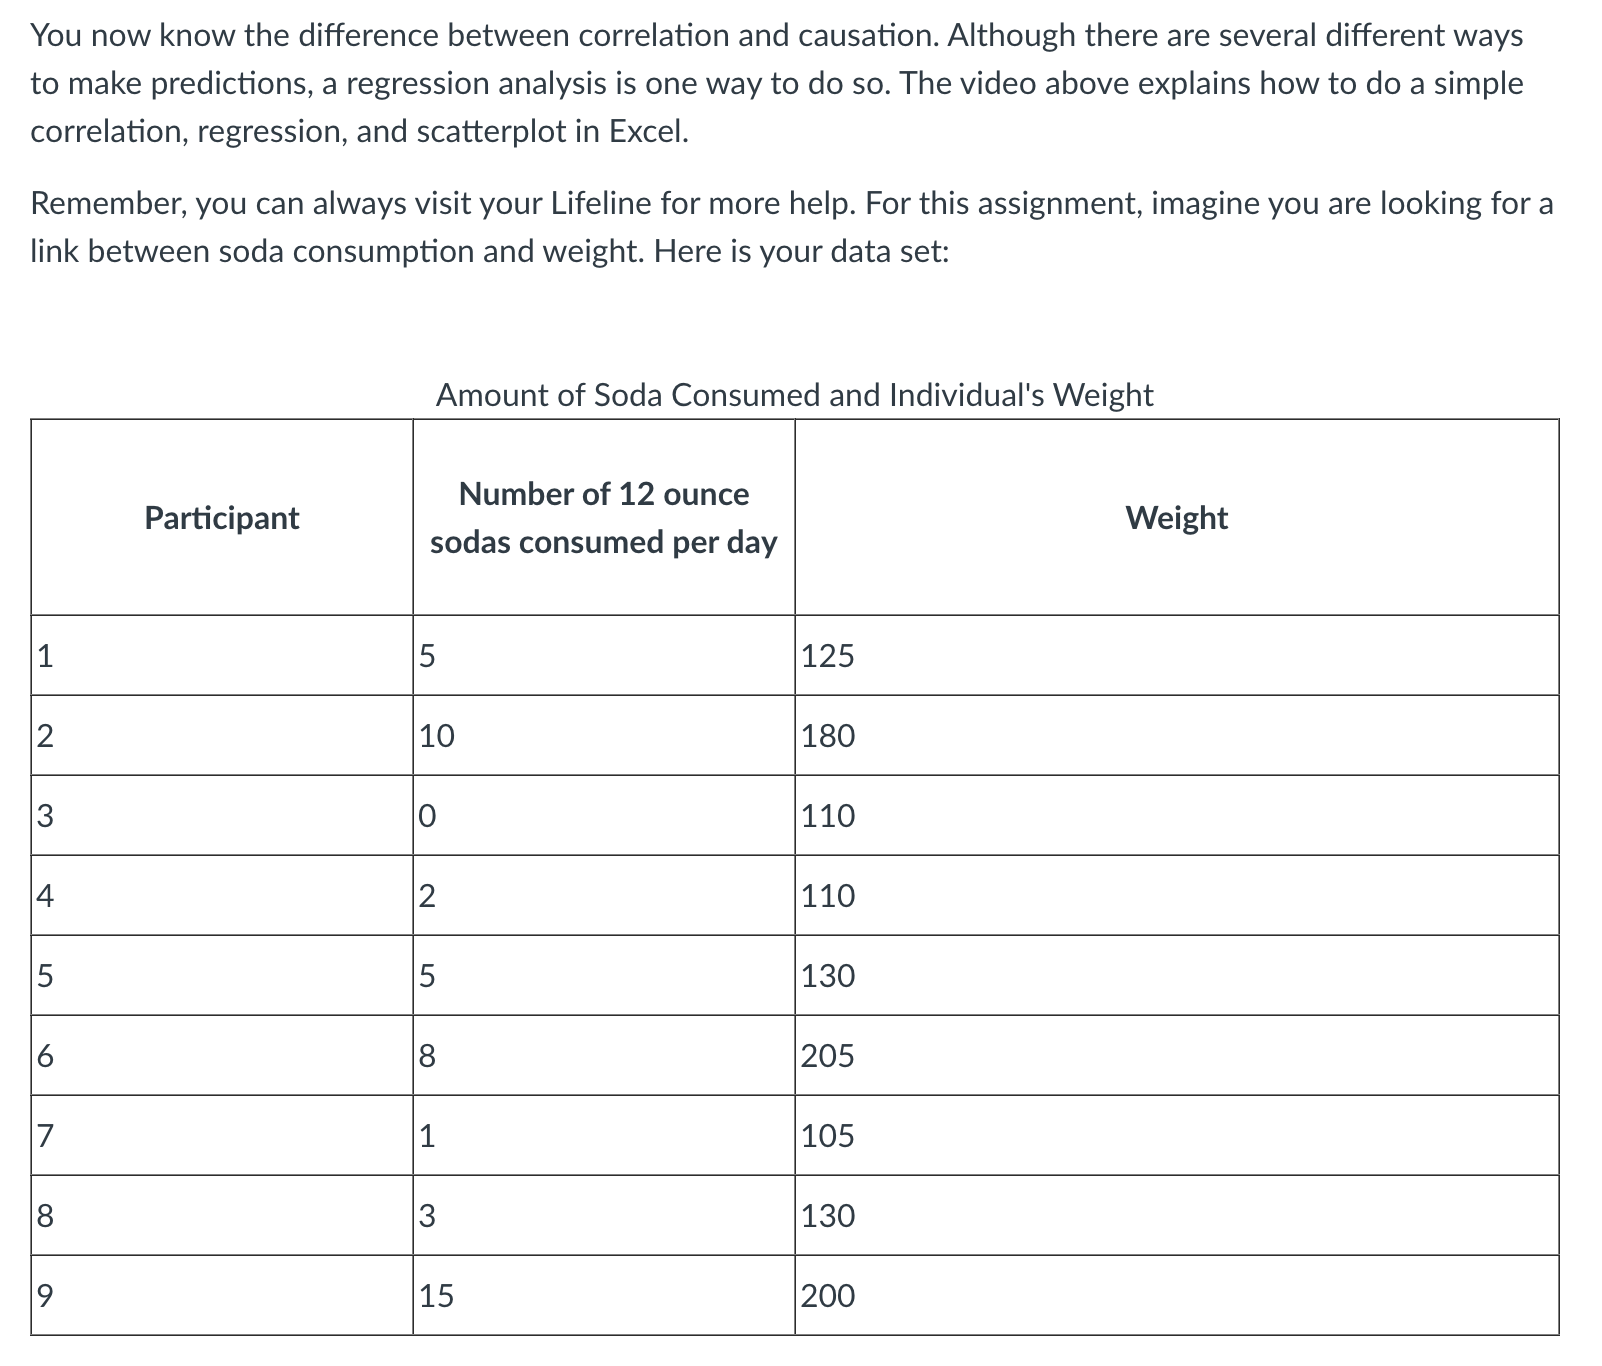
Amount of Soda Consumed and Individual's Weight Participant Number of 12 ounce sodas consumed per day Weight 1 5 125 2 10 180 3 0
| Amount of Soda Consumed and Individual's Weight | ||
| Participant | Number of 12 ounce sodas consumed per day | Weight |
| 1 | 5 | 125 |
| 2 | 10 | 180 |
| 3 | 0 | 110 |
| 4 | 2 | 110 |
| 5 | 5 | 130 |
| 6 | 8 | 205 |
| 7 | 1 | 105 |
| 8 | 3 | 130 |
| 9 | 15 | 200 |
You now know the difference between correlation and causation. Although there are several different ways to make predictions, a regression analysis is one way to do so.The videoabove explains how to do simple correlation, regression, and scatterplot in Excel.
Remember, you can always visit your Lifeline for more help. For this assignment, imagine you are looking for a link between soda consumption and weight. Here is your data set:
https://www.youtube.com/watch?v=NGFmRt2V8vo
https://www.youtube.com/watch?v=g_PH5FKBJJY
ASSIGNMENT INSTRUCTIONS
Following the instructions in the video, enter your data set on an Excel worksheet. Be sure and use the labels provided in the data set. Then:
- Perform a correlation and regression on the data in Excel.
- Create scatterplot with a regression line for your data using Excel
- Discuss your findings as if you were explaining to an individual the impact of soda consumption on weight. Is there a significant relationship between soda consumption and weight? Explain how you know this. Using your regression, predict how a person's soda consumption will impact their weight (how much will drinking additional sodas increase an individual's weight based upon your findings for this specific data set).

Step by Step Solution
There are 3 Steps involved in it
Step: 1

Get Instant Access to Expert-Tailored Solutions
See step-by-step solutions with expert insights and AI powered tools for academic success
Step: 2

Step: 3

Ace Your Homework with AI
Get the answers you need in no time with our AI-driven, step-by-step assistance
Get Started


