Answered step by step
Verified Expert Solution
Question
1 Approved Answer
amounts in millions, except per share data NET SALES Cost of Sales January 31, 2016 Fiscal Year Ended(1) February 1, 2015 February 2, 2014
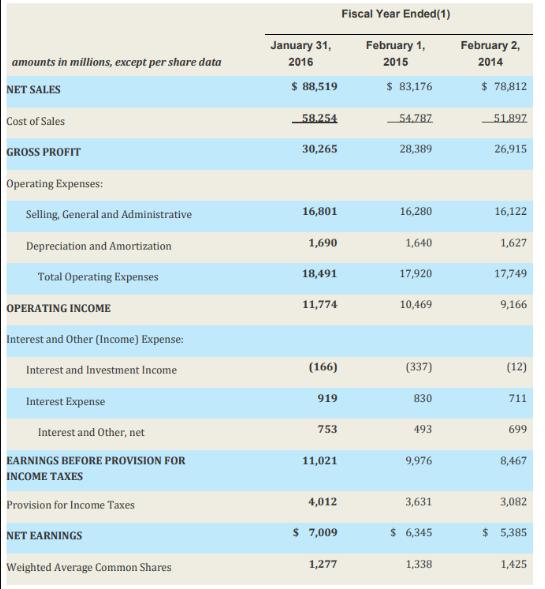
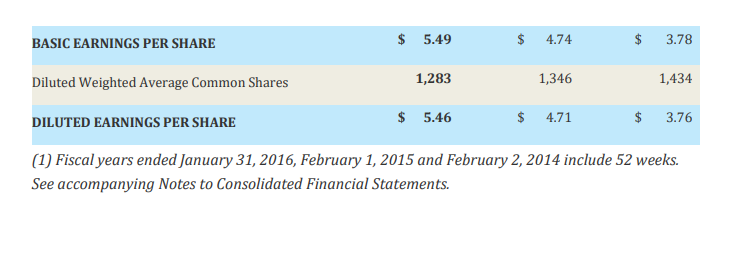
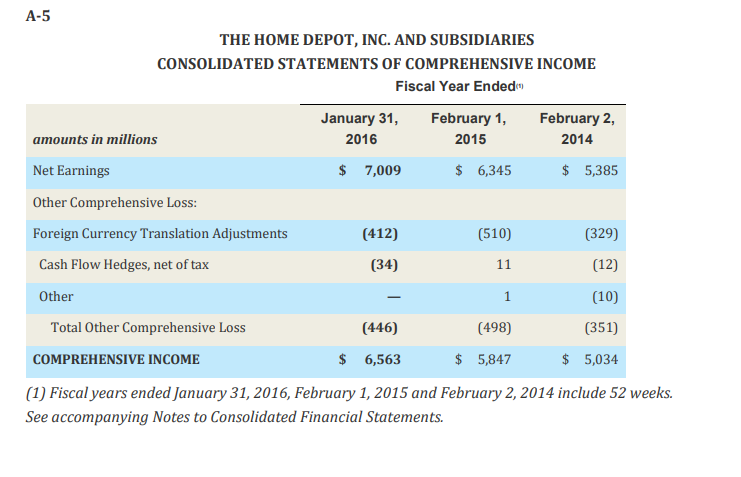
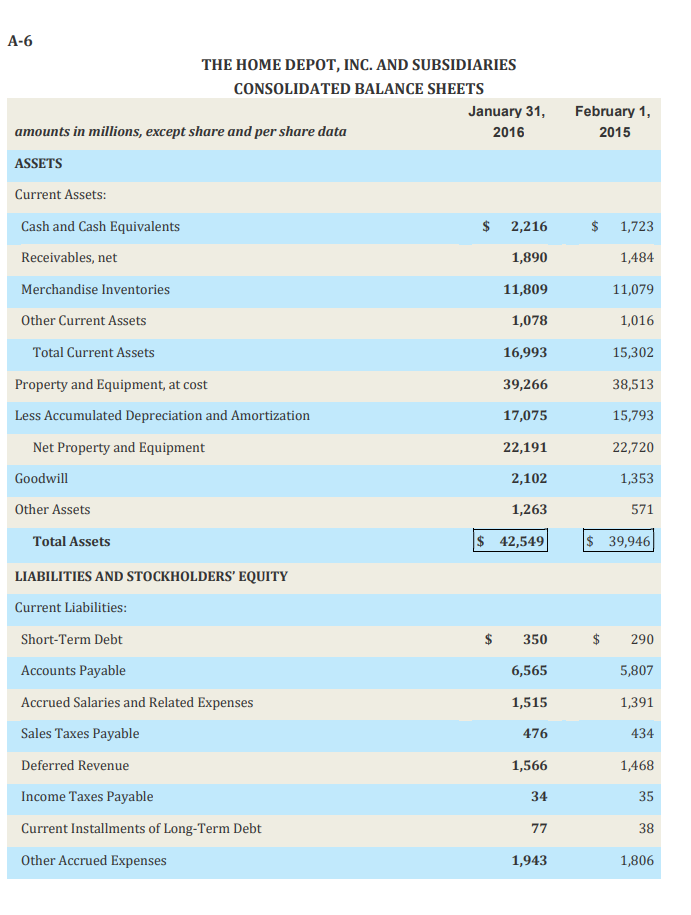
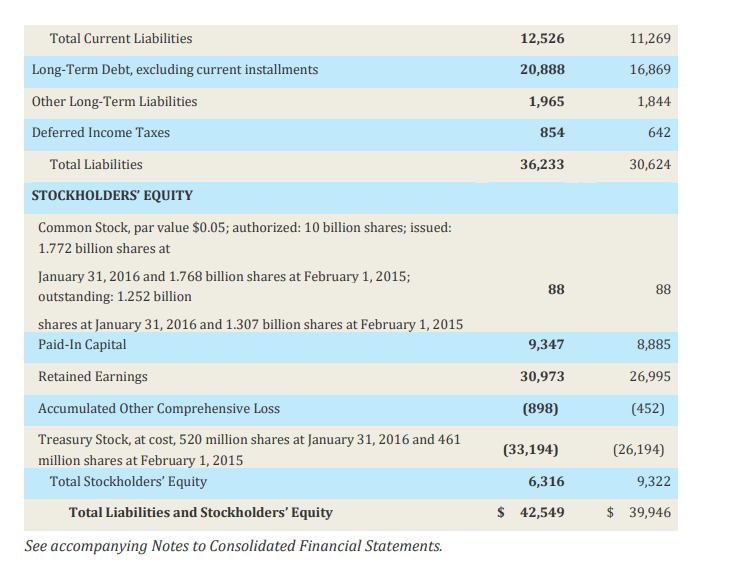
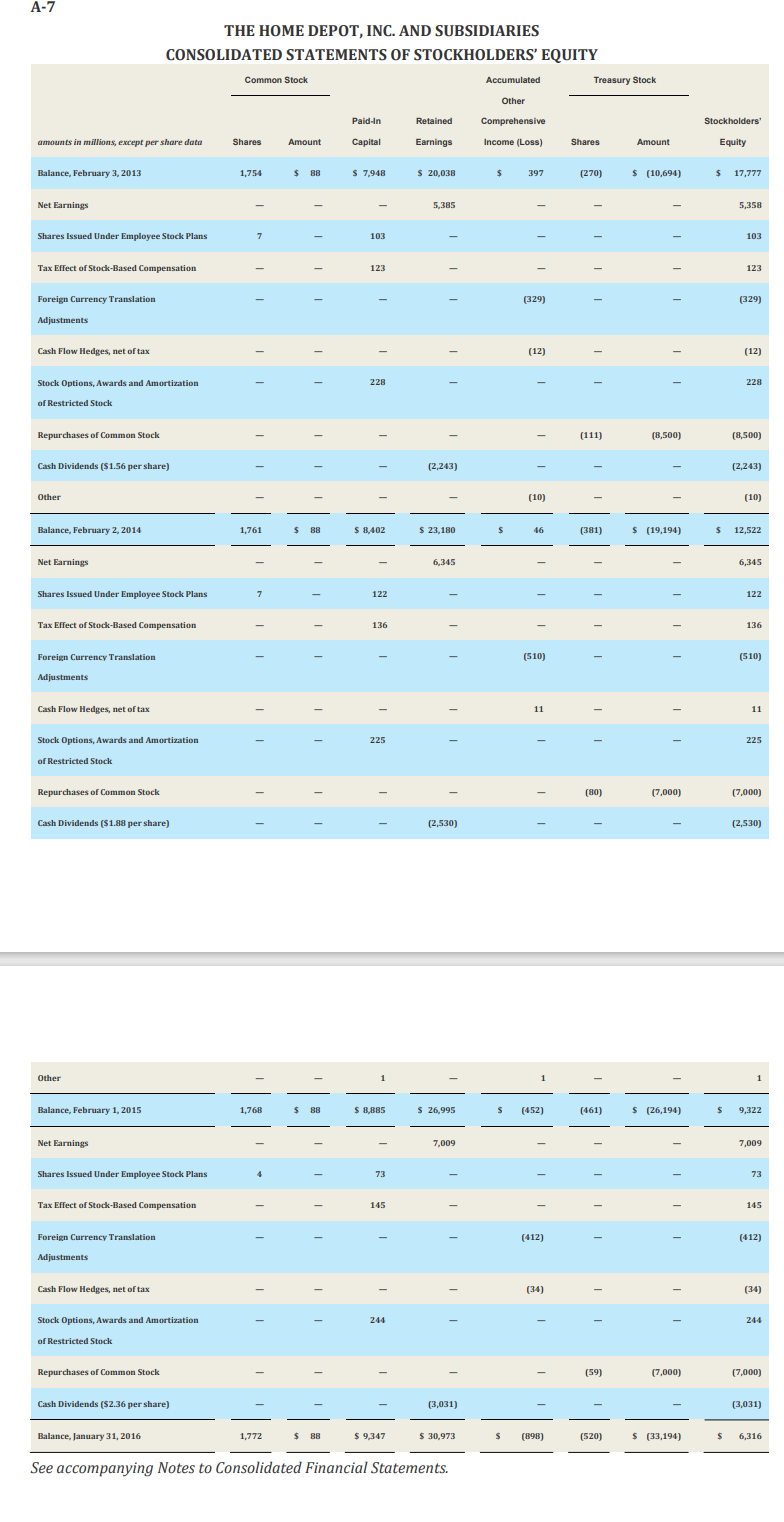
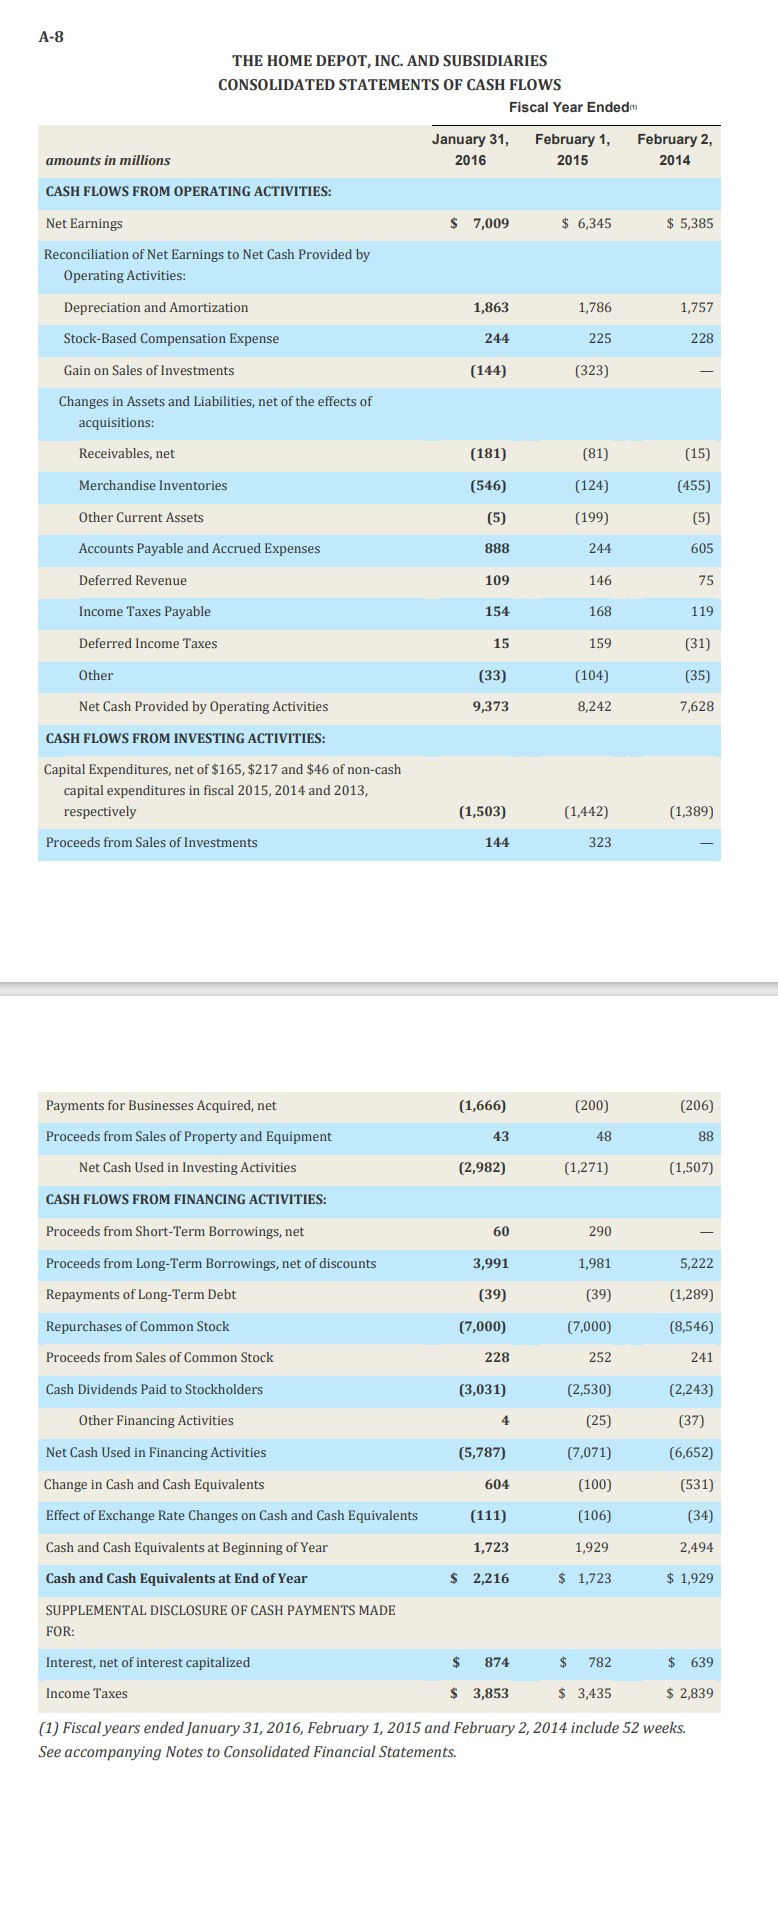
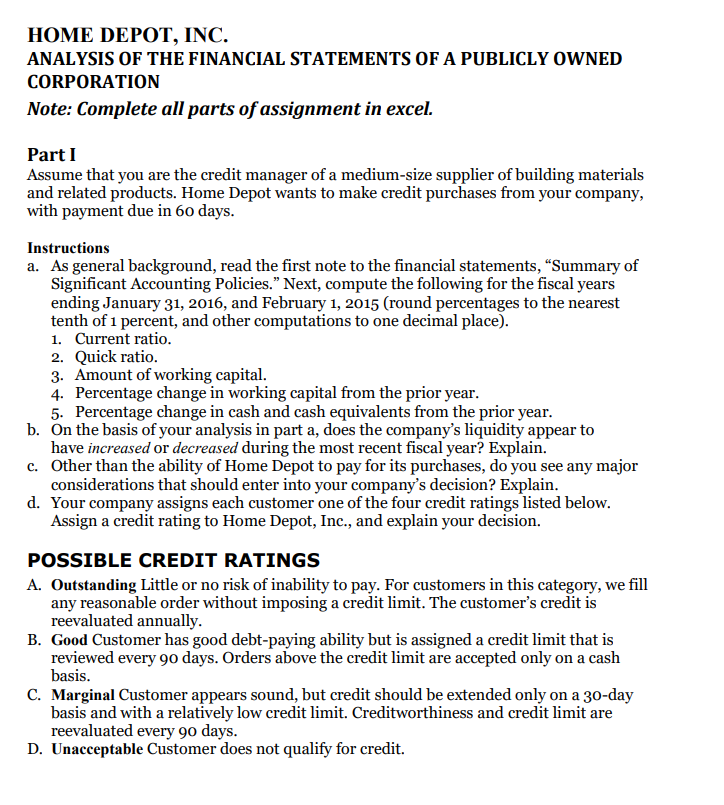
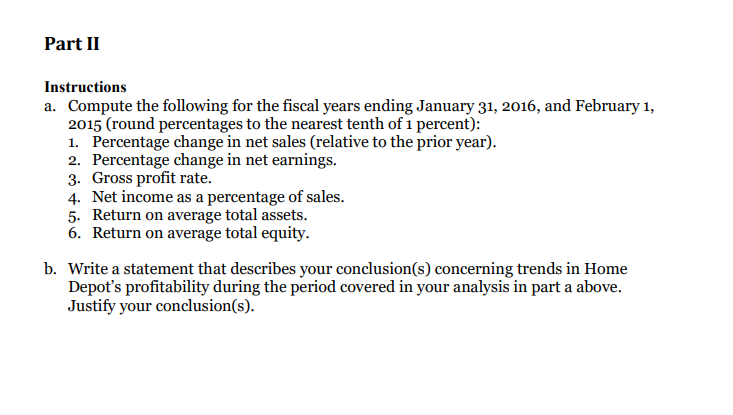
amounts in millions, except per share data NET SALES Cost of Sales January 31, 2016 Fiscal Year Ended(1) February 1, 2015 February 2, 2014 $ 88,519 $ 83,176 $ 78,812 58.254 54.787 51,897 30,265 28,389 26,915 GROSS PROFIT Operating Expenses: Selling, General and Administrative 16,801 16,280 16,122 Depreciation and Amortization 1,690 1,640 1,627 Total Operating Expenses 18,491 17,920 17,749 OPERATING INCOME 11,774 10,469 9,166 Interest and Other (Income) Expense: Interest and Investment Income (166) (337) (12) 919 830 711 Interest Expense Interest and Other, net 753 493 699 EARNINGS BEFORE PROVISION FOR 11,021 9,976 8,467 INCOME TAXES Provision for Income Taxes 4,012 3,631 3,082 NET EARNINGS 7,009 $ 6,345 $ 5,385 Weighted Average Common Shares 1,277 1,338 1,425 BASIC EARNINGS PER SHARE Diluted Weighted Average Common Shares DILUTED EARNINGS PER SHARE $ 5.49 $ 4.74 3.78 1,283 1,346 1,434 $ 5.46 $ 4.71 $ 3.76 (1) Fiscal years ended January 31, 2016, February 1, 2015 and February 2, 2014 include 52 weeks. See accompanying Notes to Consolidated Financial Statements. A-5 THE HOME DEPOT, INC. AND SUBSIDIARIES CONSOLIDATED STATEMENTS OF COMPREHENSIVE INCOME Fiscal Year Ended amounts in millions Net Earnings January 31, February 1, 2016 2015 February 2, 2014 $ 7,009 $ 6,345 $ 5,385 Other Comprehensive Loss: Foreign Currency Translation Adjustments (412) (510) (329) Cash Flow Hedges, net of tax (34) 11 (12) Other - 1 (10) Total Other Comprehensive Loss COMPREHENSIVE INCOME (446) $ 6,563 (498) (351) $ 5,847 $ 5,034 (1) Fiscal years ended January 31, 2016, February 1, 2015 and February 2, 2014 include 52 weeks. See accompanying Notes to Consolidated Financial Statements. A-6 THE HOME DEPOT, INC. AND SUBSIDIARIES CONSOLIDATED BALANCE SHEETS amounts in millions, except share and per share data January 31, February 1, 2016 2015 ASSETS Current Assets: Cash and Cash Equivalents Receivables, net Merchandise Inventories Other Current Assets $ 2,216 $ 1,723 1,890 1,484 11,809 11,079 1,078 1,016 Total Current Assets 16,993 15,302 Property and Equipment, at cost 39,266 38,513 Less Accumulated Depreciation and Amortization 17,075 15,793 Net Property and Equipment 22,191 22,720 Goodwill Other Assets Total Assets LIABILITIES AND STOCKHOLDERS' EQUITY 2,102 1,353 1,263 571 $ 42,549 $ 39,946 Current Liabilities: Short-Term Debt $ 350 $ 290 Accounts Payable 6,565 5,807 Accrued Salaries and Related Expenses 1,515 1,391 Sales Taxes Payable 476 434 Deferred Revenue 1,566 1,468 Income Taxes Payable 34 35 Current Installments of Long-Term Debt 77 38 Other Accrued Expenses 1,943 1,806 Total Current Liabilities 12,526 11,269 Long-Term Debt, excluding current installments 20,888 16,869 Other Long-Term Liabilities 1,965 1,844 Deferred Income Taxes 854 642 Total Liabilities 36,233 30,624 STOCKHOLDERS' EQUITY Common Stock, par value $0.05; authorized: 10 billion shares; issued: 1.772 billion shares at January 31, 2016 and 1.768 billion shares at February 1, 2015; 88 88 outstanding: 1.252 billion shares at January 31, 2016 and 1.307 billion shares at February 1, 2015 Paid-In Capital 9,347 8,885 Retained Earnings 30,973 26,995 Accumulated Other Comprehensive Loss (898) (452) Treasury Stock, at cost, 520 million shares at January 31, 2016 and 461 million shares at February 1, 2015 Total Stockholders' Equity Total Liabilities and Stockholders' Equity See accompanying Notes to Consolidated Financial Statements. (33,194) (26,194) 6,316 9,322 $ 42,549 $ 39,946 A-7 THE HOME DEPOT, INC. AND SUBSIDIARIES CONSOLIDATED STATEMENTS OF STOCKHOLDERS' EQUITY Common Stock Accumulated Treasury Stock Paid-In Retained Other Comprehensive amounts in millions, except per share data Shares Amount Capital Earnings Income (Loss) Shares Amount Stockholders' Equity Balance, February 3, 2013 1,754 $ 88 $ 7,948 $ 20,038 397 (270) $ (10,694) $ 17,777 Net Earnings Shares Issued Under Employee Stock Plans Tax Effect of Stock-Based Compensation Foreign Currency Translation Adjustments Cash Flow Hedges, net of tax Stock Options, Awards and Amortization of Restricted Stock 103 | 228 Repurchases of Common Stock Cash Dividends ($1.56 per share) Other 5,385 (2,243) (329) (12) (10) 5,358 103 123 (329) (12) 228 (111) (8,500) (8,500) (2,243) (10) Balance, February 2, 2014 1,761 $ 8,402 $ 23,180 $ 46 (381) $ (19,194) $ 12,522 Net Earnings Shares Issued Under Employee Stock Plans Tax Effect of Stock-Based Compensation Foreign Currency Translation Adjustments Cash Flow Hedges, net of tax Stock Options, Awards and Amortization of Restricted Stock Repurchases of Common Stock Cash Dividends ($1.88 per share) Other 122 136 225 6,345 1 (2,530) 6,345 122 136 (510) (510) 11 11 (80) (7,000) (7,000) (2,530) Balance, February 1, 2015 1,768 $ 8,885 $ 26,995 (452) (461) $ (26,194) 9,322 Net Earnings Shares Issued Under Employee Stock Plans Tax Effect of Stock-Based Compensation Foreign Currency Translation Adjustments Cash Flow Hedges, net of tax 73 145 7,009 7,009 73 145 (412) (412) (34) (34) Stock Options, Awards and Amortization 244 of Restricted Stock Repurchases of Common Stock (59) (7,000) (7,000) Cash Dividends ($2.36 per share) (3,031) (3,031) Balance, January 31, 2016 1,772 $ 88 $ 9,347 $ 30,973 $ (898) (520) $ (33,194) 6,316 See accompanying Notes to Consolidated Financial Statements. A-8 THE HOME DEPOT, INC. AND SUBSIDIARIES CONSOLIDATED STATEMENTS OF CASH FLOWS Fiscal Year Ended January 31, amounts in millions 2016 February 1, 2015 February 2, 2014 CASH FLOWS FROM OPERATING ACTIVITIES: Net Earnings Reconciliation of Net Earnings to Net Cash Provided by $ 7,009 $ 6,345 $ 5,385 Operating Activities: Depreciation and Amortization 1,863 1,786 1,757 Stock-Based Compensation Expense 244 225 228 Gain on Sales of Investments (144) (323) Changes in Assets and Liabilities, net of the effects of acquisitions: Receivables, net (181) (81) (15) Merchandise Inventories (546) (124) (455) Other Current Assets (5) (199) (5) Accounts Payable and Accrued Expenses 888 244 605 Deferred Revenue 109 146 75 Income Taxes Payable 154 168 119 Deferred Income Taxes 15 159 (31) Other (33) (104) (35) Net Cash Provided by Operating Activities 9,373 8,242 7,628 CASH FLOWS FROM INVESTING ACTIVITIES: Capital Expenditures, net of $165, $217 and $46 of non-cash capital expenditures in fiscal 2015, 2014 and 2013, respectively Proceeds from Sales of Investments Payments for Businesses Acquired, net Proceeds from Sales of Property and Equipment Net Cash Used in Investing Activities CASH FLOWS FROM FINANCING ACTIVITIES: (1,503) (1,442) 144 323 (1,389) (1,666) (200) (206) 43 48 88 (2,982) (1,271) (1,507) Proceeds from Short-Term Borrowings, net 60 290 Proceeds from Long-Term Borrowings, net of discounts 3,991 1,981 5,222 Repayments of Long-Term Debt (39) (39) (1,289) Repurchases of Common Stock (7,000) (7,000) (8,546) Proceeds from Sales of Common Stock 228 252 241 Cash Dividends Paid to Stockholders (3,031) (2,530) (2,243) Other Financing Activities 4 (25) (37) Net Cash Used in Financing Activities (5,787) (7,071) (6,652) Change in Cash and Cash Equivalents 604 (100) (531) Effect of Exchange Rate Changes on Cash and Cash Equivalents (111) (106) (34) Cash and Cash Equivalents at Beginning of Year 1,723 1,929 2,494 Cash and Cash Equivalents at End of Year $ 2,216 $ 1,723 $ 1,929 SUPPLEMENTAL DISCLOSURE OF CASH PAYMENTS MADE FOR: Interest, net of interest capitalized $ 874 $ 782 $ 639 Income Taxes $ 3,853 $ 3,435 $ 2,839 (1) Fiscal years ended January 31, 2016, February 1, 2015 and February 2, 2014 include 52 weeks. See accompanying Notes to Consolidated Financial Statements. HOME DEPOT, INC. ANALYSIS OF THE FINANCIAL STATEMENTS OF A PUBLICLY OWNED CORPORATION Note: Complete all parts of assignment in excel. Part I Assume that you are the credit manager of a medium-size supplier of building materials and related products. Home Depot wants to make credit purchases from your company, with payment due in 60 days. Instructions a. As general background, read the first note to the financial statements, "Summary of Significant Accounting Policies." Next, compute the following for the fiscal years ending January 31, 2016, and February 1, 2015 (round percentages to the nearest tenth of 1 percent, and other computations to one decimal place). 1. Current ratio. 2. Quick ratio. 3. Amount of working capital. 4. Percentage change in working capital from the prior year. 5. Percentage change in cash and cash equivalents from the prior year. b. On the basis of your analysis in part a, does the company's liquidity appear to have increased or decreased during the most recent fiscal year? Explain. c. Other than the ability of Home Depot to pay for its purchases, do you see any major considerations that should enter into your company's decision? Explain. d. Your company assigns each customer one of the four credit ratings listed below. Assign a credit rating to Home Depot, Inc., and explain your decision. POSSIBLE CREDIT RATINGS A. Outstanding Little or no risk of inability to pay. For customers in this category, we fill any reasonable order without imposing a credit limit. The customer's credit is reevaluated annually. B. Good Customer has good debt-paying ability but is assigned a credit limit that is reviewed every 90 days. Orders above the credit limit are accepted only on a cash basis. C. Marginal Customer appears sound, but credit should be extended only on a 30-day basis and with a relatively low credit limit. Creditworthiness and credit limit are reevaluated every 90 days. D. Unacceptable Customer does not qualify for credit. Part II Instructions a. Compute the following for the fiscal years ending January 31, 2016, and February 1, 2015 (round percentages to the nearest tenth of 1 percent): 1. Percentage change in net sales (relative to the prior year). 2. Percentage change in net earnings. 3. Gross profit rate. 4. Net income as a percentage of sales. 5. Return on average total assets. 6. Return on average total equity. b. Write a statement that describes your conclusion(s) concerning trends in Home Depot's profitability during the period covered in your analysis in part a above. Justify your conclusion(s).
Step by Step Solution
There are 3 Steps involved in it
Step: 1
Answer Lets calculate the values requested in Part I and Part II Part I a Compute the following for the fiscal years ending January 31 2016 and February 1 2015 1 Current Ratio Current Ratio Current As...
Get Instant Access to Expert-Tailored Solutions
See step-by-step solutions with expert insights and AI powered tools for academic success
Step: 2

Step: 3

Ace Your Homework with AI
Get the answers you need in no time with our AI-driven, step-by-step assistance
Get Started


