

Answered step by step
Verified Expert Solution
Question
1 Approved Answer
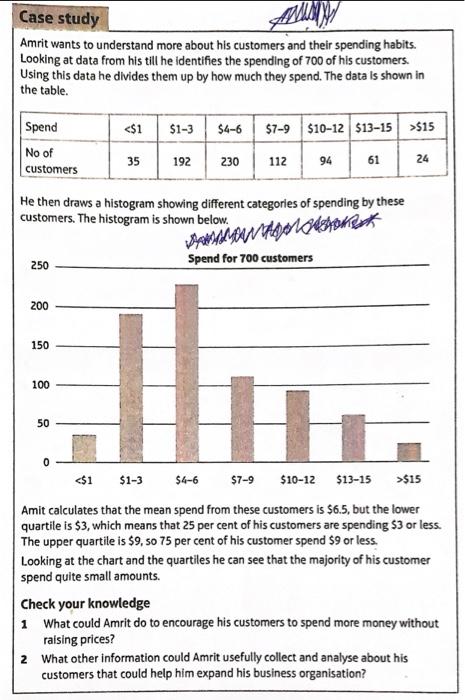
Amrit wants to understand more about his customers and their spending habits. Looking at data from his till he identifies the spending of 700 of
Step by Step Solution
There are 3 Steps involved in it
Step: 1

Get Instant Access to Expert-Tailored Solutions
See step-by-step solutions with expert insights and AI powered tools for academic success
Step: 2

Step: 3
Ace Your Homework with AI
Get the answers you need in no time with our AI-driven, step-by-step assistance
Get Started
Research In Finance Volume 24
Authors: Andrew H. Chen
1st Edition
0762313773, 978-0762313778