

Answered step by step
Verified Expert Solution
Question
1 Approved Answer
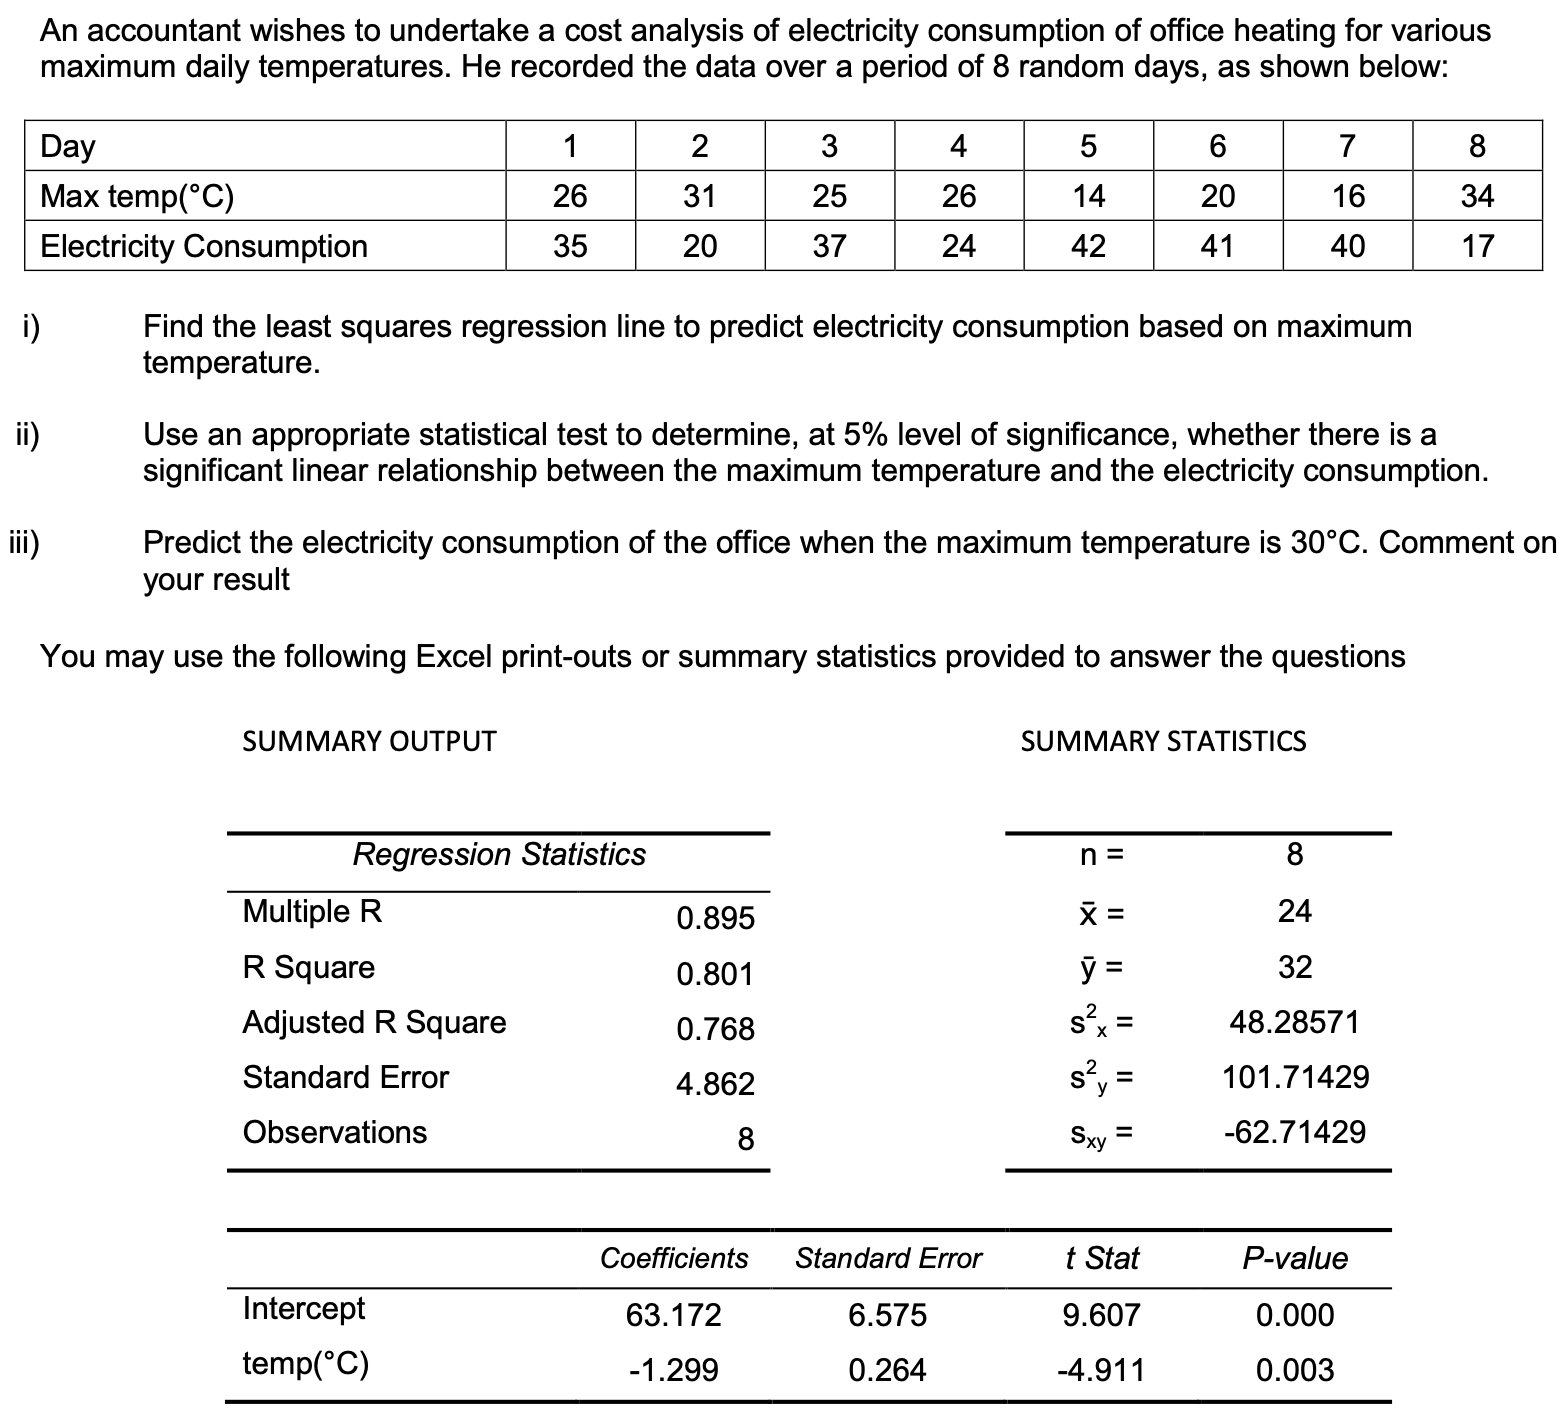
An accountant wishes to undertake a cost analysis of electricity consumption of office heating for various maximum daily temperatures. He recorded the data over a

Step by Step Solution
There are 3 Steps involved in it
Step: 1

Get Instant Access to Expert-Tailored Solutions
See step-by-step solutions with expert insights and AI powered tools for academic success
Step: 2

Step: 3
Ace Your Homework with AI
Get the answers you need in no time with our AI-driven, step-by-step assistance
Get Started
Differential Equations With Boundary Value Problems
Authors: Martha L L Abell, James P Braselton
4th Edition
0124172822, 9780124172821