

Question: An article in Optical Engineering [Operating Curve Extraction of a Correlator's Filter (2004, Vol. 43, pp. 2775-2779)] reported on use of an optical correlator to
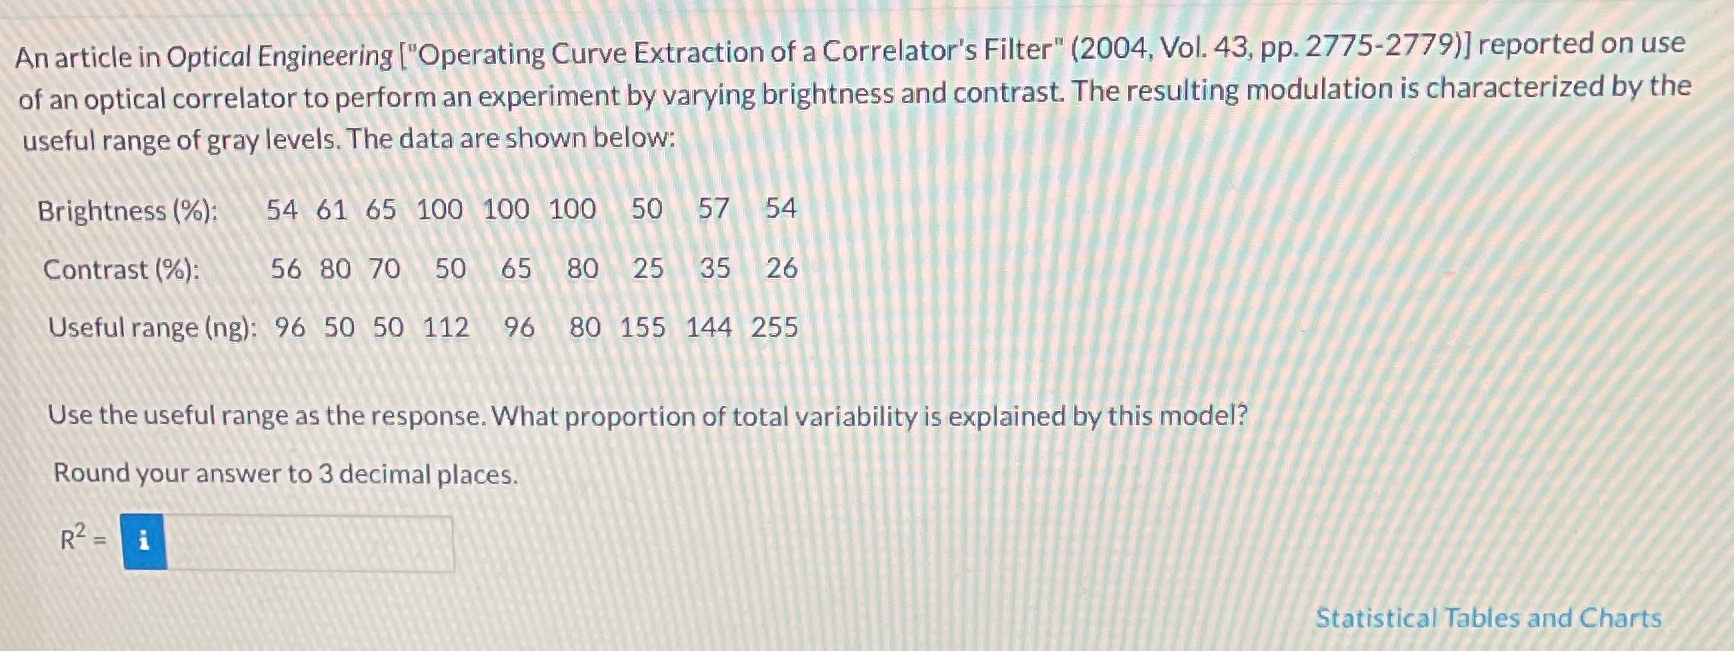
An article in Optical Engineering ["Operating Curve Extraction of a Correlator's Filter" (2004, Vol. 43, pp. 2775-2779)] reported on use of an optical correlator to perform an experiment by varying brightness and contrast. The resulting modulation is characterized by the useful range of gray levels. The data are shown below: Brightness (%): 54 61 65 100 100 100 50 57 54 Contrast (%): 56 80 70 50 65 80 25 35 26 Useful range (ng): 96 50 50 112 96 80 155 144 255 Use the useful range as the response. What proportion of total variability is explained by this model? Round your answer to 3 decimal places. R2 = Statistical Tables and Charts
Step by Step Solution
There are 3 Steps involved in it

Get step-by-step solutions from verified subject matter experts