Answered step by step
Verified Expert Solution
Question
1 Approved Answer
An article in the Journal of the American Statistical Association [Markov Chain Monte Carlo Methods for Computing Bayes Factors: A Comparative Review (2001, Vol.


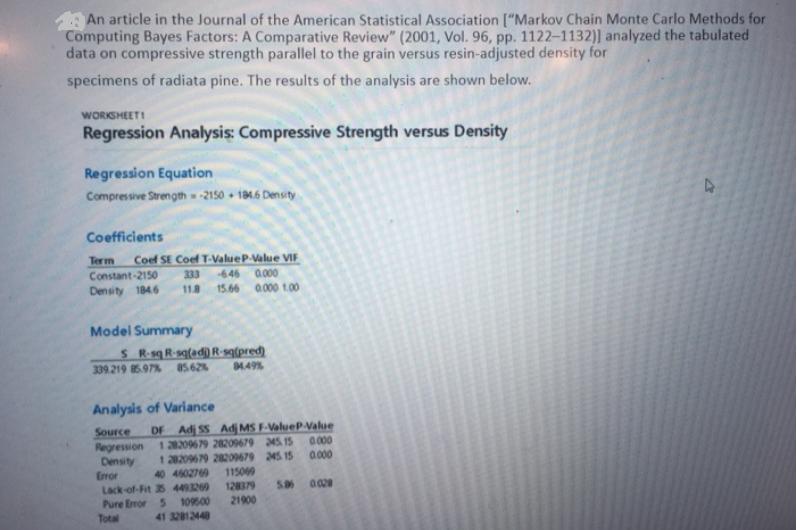
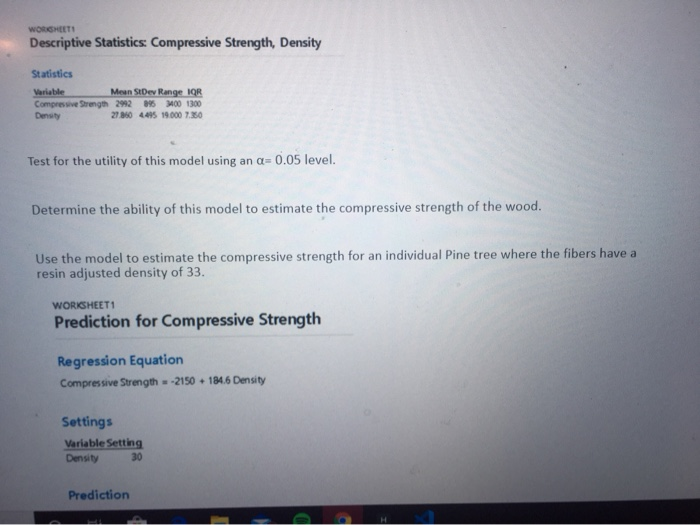
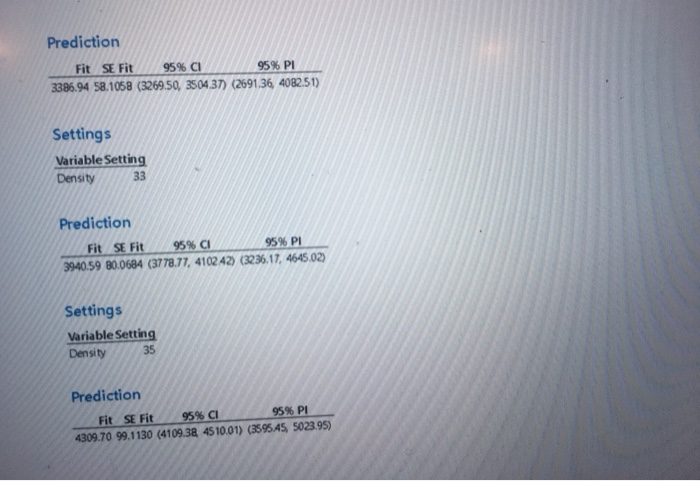
An article in the Journal of the American Statistical Association ["Markov Chain Monte Carlo Methods for Computing Bayes Factors: A Comparative Review" (2001, Vol. 96, pp. 1122-1132)] analyzed the tabulated data on compressive strength parallel to the grain versus resin-adjusted density for specimens of radiata pine. The results of the analysis are shown below. WORKSHEET! Regression Analysis: Compressive Strength versus Density Regression Equation Compressive Strength -2150 - 184.6 Density Coefficients Term Coef SE Coef T-ValueP-Value VIF Constant-2150 333 -646 0.000 Density 1846 11.8 15.66 0.000 1.00 Model Summary SR-sq R-sq(adj) R-sq(pred) 339.219 85.97% 85.62% 34.49% Analysis of Variance Source DF Adj SS Adj MS F-ValueP-Value 128209679 28209679 245.15 128209679 28209679 245. 15 115009 40 4602769 Regression Density Error 128379 Lack-of-Fit 35 4493269 Pure Emor 5 109500 21900 Total 0.000 0.000 5.96 0.029 WORKSHEETS Descriptive Statistics: Compressive Strength, Density Statistics Variable Mean StDev Range IQR Compressive Strength 2992 895 3400 1300 Density 27.860 4.495 19.000 7.350 Test for the utility of this model using an a= 0.05 level. Determine the ability of this model to estimate the compressive strength of the wood. Use the model to estimate the compressive strength for an individual Pine tree where the fibers have a resin adjusted density of 33. WORKSHEET1 Prediction for Compressive Strength Regression Equation Compressive Strength=-2150 + 184.6 Density Settings Variable Setting Density 30 Prediction Prediction Fit SE Fit 95% CI 95% PI 3386.94 58.1058 (3269.50, 3504.37) (2691.36, 4082.51) Settings Variable Setting Density 33 Prediction Fit SE Fit 95% CI 95% PI 3940.59 80.0684 (3778.77, 410242) (3236.17, 4645.02) Settings Variable Setting Density 35 Prediction 95% CI 95% Pl Fit SE Fit 4309.70 99,1130 (4109.38 4510.01) (3595.45, 5023.95)
Step by Step Solution
There are 3 Steps involved in it
Step: 1

Get Instant Access to Expert-Tailored Solutions
See step-by-step solutions with expert insights and AI powered tools for academic success
Step: 2

Step: 3

Ace Your Homework with AI
Get the answers you need in no time with our AI-driven, step-by-step assistance
Get Started


